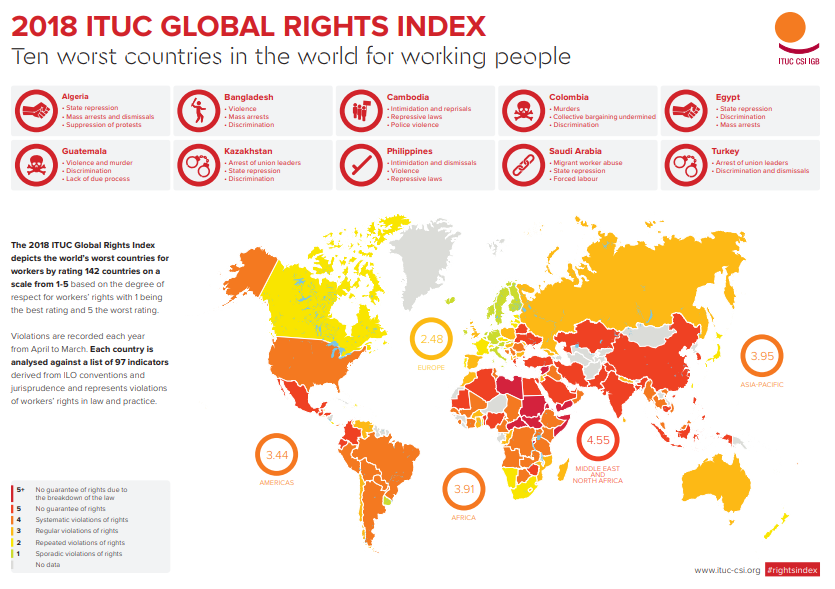
The 2018 ITUC Global Rights Index depicts the world’s worst countries for workers by rating 142 countries on a scale from 1-5 based on the degree of respect for workers’ rights with 1 being the best rating and 5 the worst rating. Violations are recorded each year from April to March. Each country is analysed against a list of 97 indicators derived from ILO conventions and jurisprudence and represents violations of workers’ rights in law and practice.

Download the full infographic in pdf below.

ITUC Global Rights Index 2018: Ten worst countries in the world for working people DOWNLOAD

post

page

attachment

revision

nav_menu_item

custom_css

customize_changeset

oembed_cache

user_request

wp_block

acf-field-group

acf-field

ai1ec_event

Counter-trafficking Regional and Global Statistics at a glance
GuidanceStandards & Codes of ConductGood PracticesGraphics & Infographics

This report provides statistics and minor analysis regarding the demographics of those trafficked in 2015.

TAGS: Global
National Hotline 2017 Oklahoma State Report
Graphics & InfographicsPublications

The data in this report represents signals and cases from January 1, 2017 through December 31, 2017 and is accurate as of July 11, 2018. Cases of trafficking may be ongoing or new information may be revealed to the National Hotline over time. Conseq...Read More

National Hotline 2018 Connecticut State Report
Graphics & InfographicsPublications

The data in this report represents signals and cases from January 1, 2018 through December 31, 2018 and is accurate as of July 25, 2019. Cases of trafficking may be ongoing or new information may revealed to the National Hotline over time. Consequen...Read More

National Hotline 2017 New York State Report
Graphics & InfographicsPublications

The data in this report represents signals and cases from January 1, 2017 through December 31, 2017 and is accurate as of July 11, 2018. Cases of trafficking may be ongoing or new information may be revealed to the National Hotline over time. Conseq...Read More