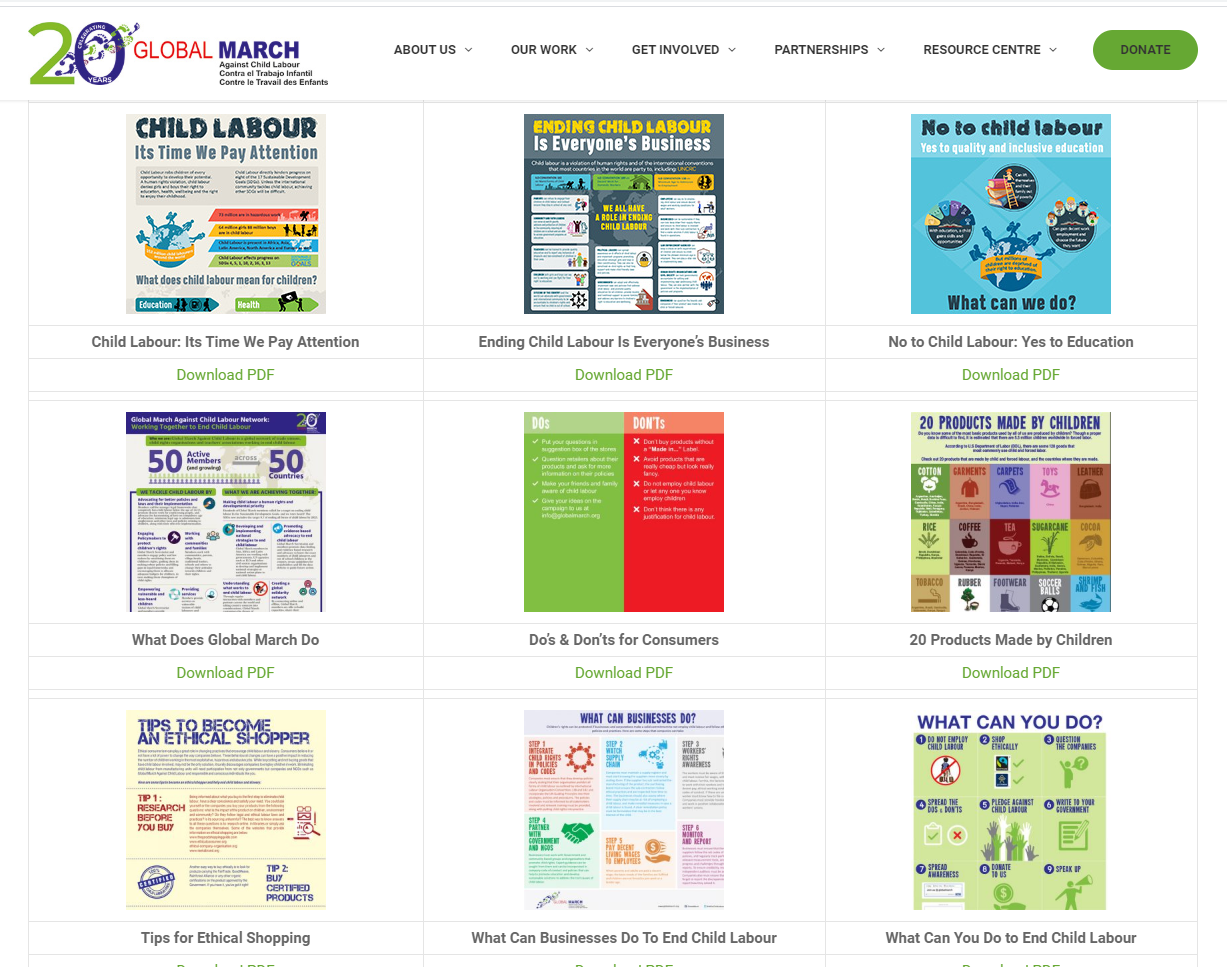
This web page collects a number of different infographics developed by the Global March against Child Labour on the topic of child labour, that can be used for a variety of purposes including raising awareness of consumers.

The infographics can be accessed through this link.

post

page

attachment

revision

nav_menu_item

custom_css

customize_changeset

oembed_cache

user_request

wp_block

wp_template

wp_template_part

wp_global_styles

wp_navigation

wp_font_family

wp_font_face

acf-taxonomy

acf-post-type

acf-field-group

acf-field

ai1ec_event

exactmetrics_note

National Hotline 2018 Nebraska State Report
Graphics & InfographicsPublications

The data in this report represents signals and cases from January 1, 2018 through December 31, 2018 and is accurate as of July 25, 2019. Cases of trafficking may be ongoing or new information may revealed to the National Hotline over time. Consequen...Read More

List of Goods Produced by Child Labor or Forced Labor – The 2016 List in Numbers
Graphics & Infographics

The U.S. Department of Labor's Bureau Of International Labor Affairs (ILAB) maintains a list of goods and their source countries which it has reason to believe are produced by child labour or forced labour in violation of international standards, as ...Read More

National Hotline 2019 Rhode Island State Report
Graphics & InfographicsPublications

The data in this report represents signals and cases from January 1, 2019 through December 31, 2019 and is accurate as of July 30, 2020. Cases of trafficking may be ongoing or new information may revealed to the National Hotline over time. Consequen...Read More

National Hotline 2018 New York State Report
Graphics & InfographicsPublications

The data in this report represents signals and cases from January 1, 2018 through December 31, 2018 and is accurate as of July 25, 2019. Cases of trafficking may be ongoing or new information may revealed to the National Hotline over time. Consequen...Read More