Ending child labour will be decided in agriculture
Graphics & InfographicsThe necessary steps towards eliminating child labour and accelerating towards achieving SDG 8.7 Infographic accessible here. ...Read More
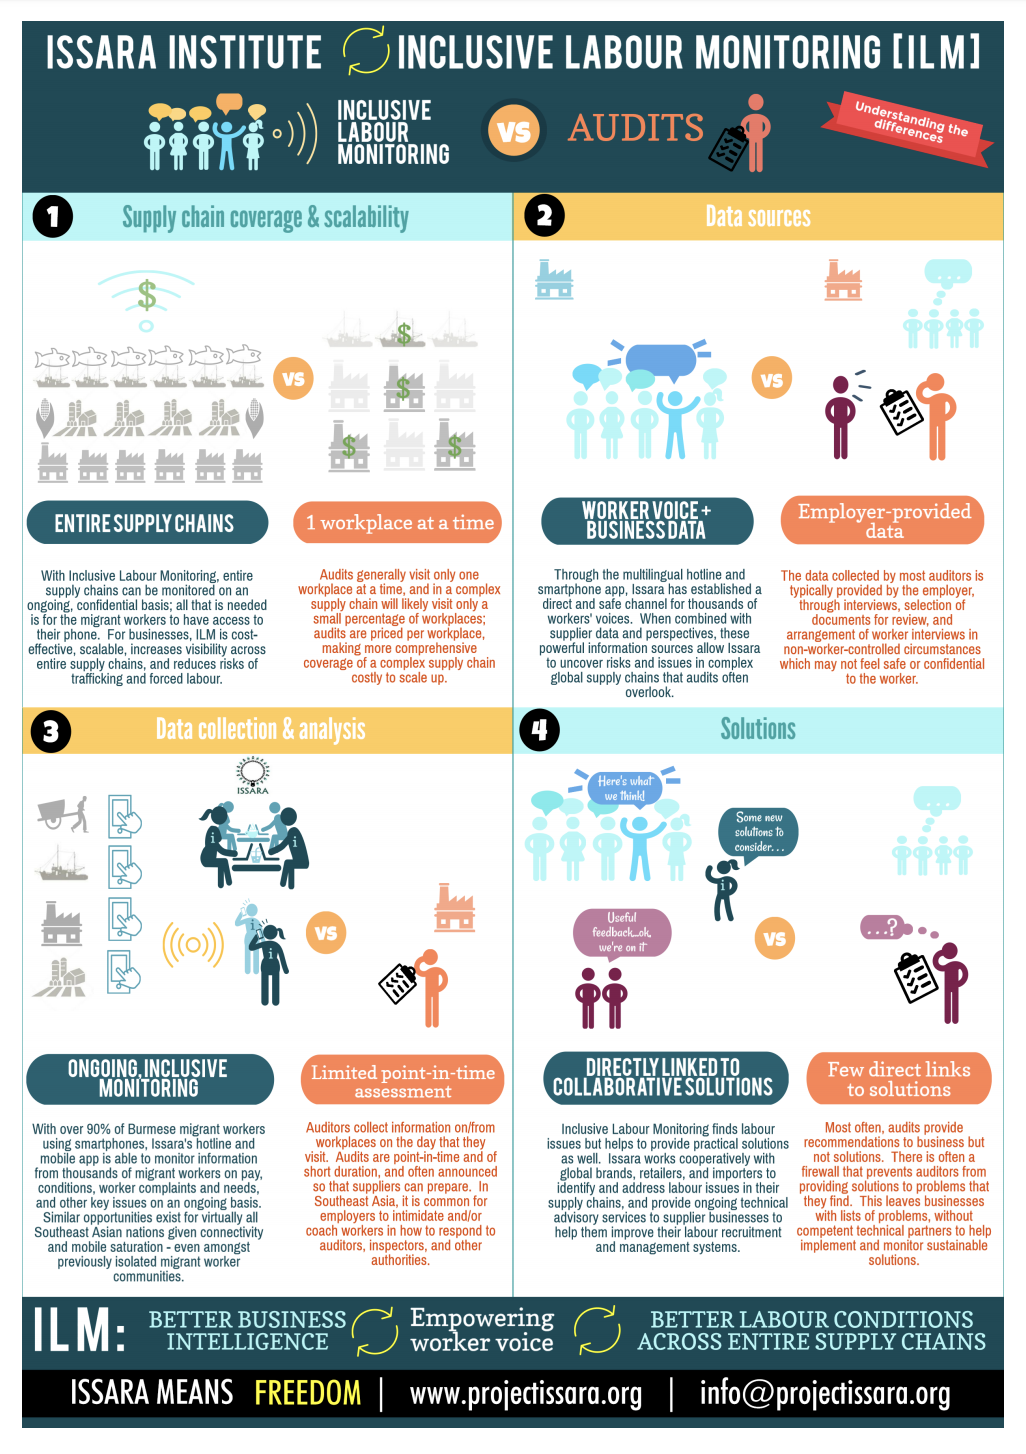
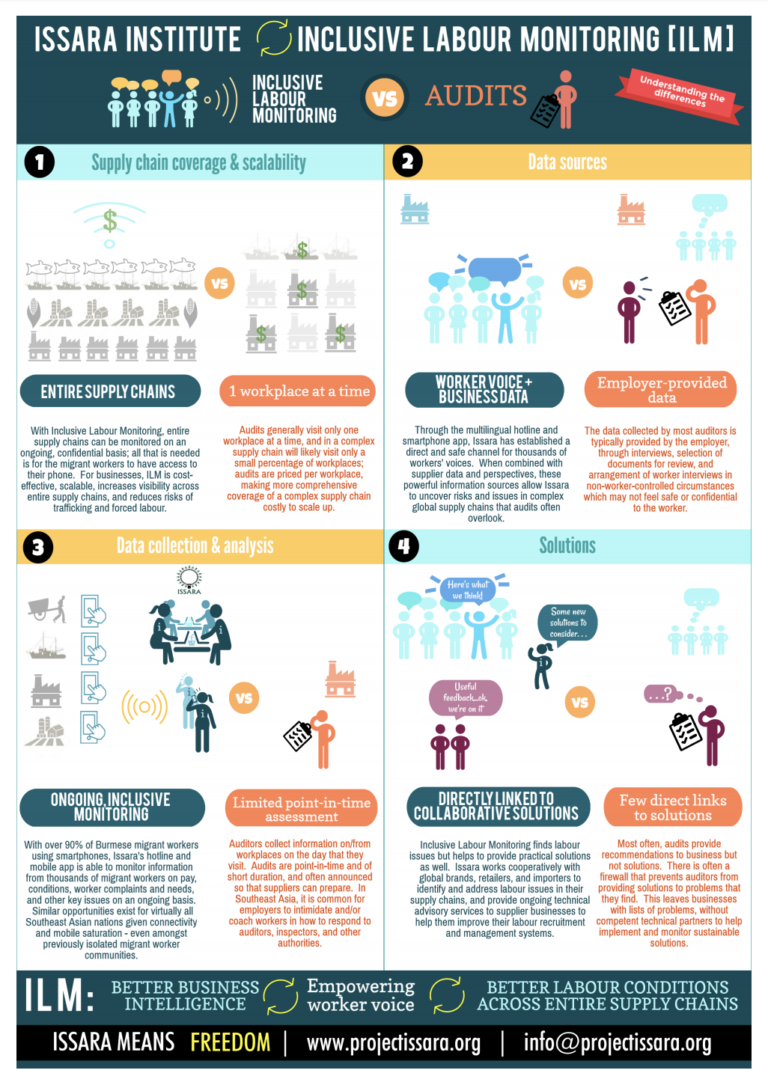
Infographic detailing the steps for Inclusive Labour Monitoring (ILM), and the advantages of this approach in comparison to auditing.

The infographic can be found here, or dowloaded below.

The necessary steps towards eliminating child labour and accelerating towards achieving SDG 8.7 Infographic accessible here. ...Read More
The data in this report represents signals and cases from January 1, 2019 through December 31, 2019 and is accurate as of July 30, 2020. Cases of trafficking may be ongoing or new information may revealed to the National Hotline over time. Consequen...Read More
The data in this report represents signals and cases from January 1, 2018 through December 31, 2018 and is accurate as of July 25, 2019. Cases of trafficking may be ongoing or new information may revealed to the National Hotline over time. Consequen...Read More
The data in this report represents signals and cases from January 1, 2017 through December 31, 2017 and is accurate as of July 11, 2018. Cases of trafficking may be ongoing or new information may be revealed to the National Hotline over time. Conseq...Read More