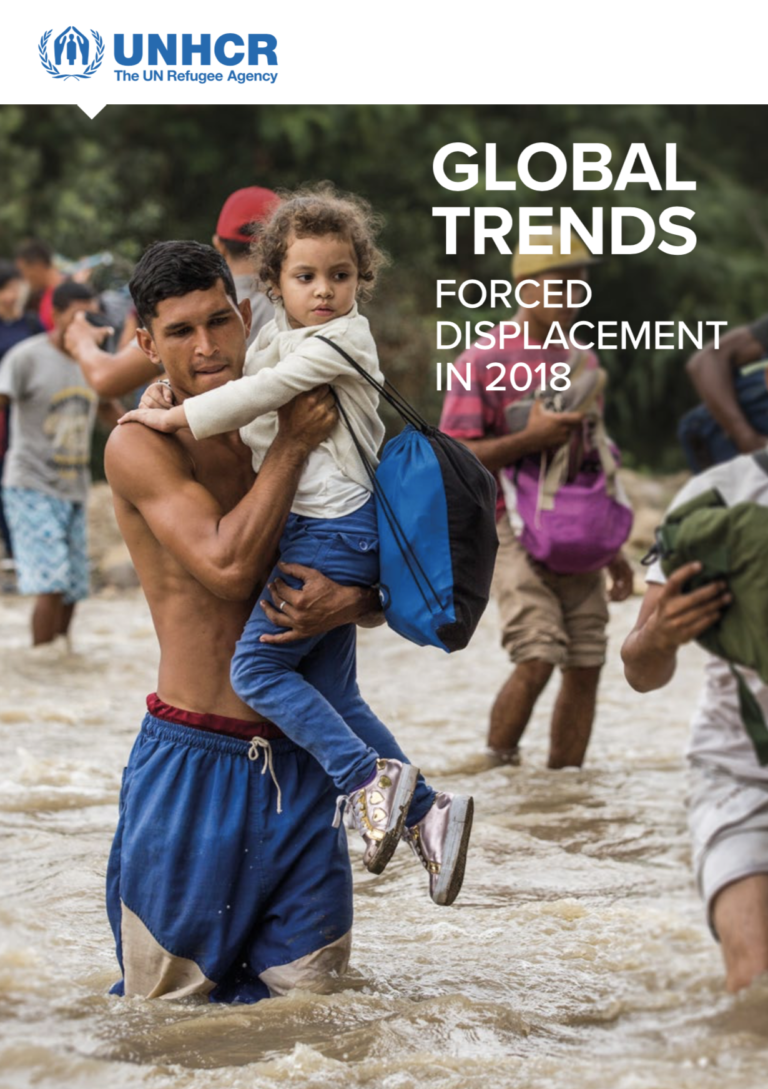
The global population of forcibly displaced increased by 2.3 million people in 2018. By the end of the year, almost 70.8 million individuals were forcibly displaced worldwide as a result of persecution, conflict, violence, or human rights violations. As a result, the world’s forcibly displaced population remained yet again at a record high.

This Global Trends report analyses statistical trends and changes in global displacement from January to December 2018 in populations for whom UNHCR has been entrusted with a responsibility by the international community, including refugees, asylum-seekers, returnees, stateless people and conflict-affected internally displaced people.

Global Trends: Forced Displacement in 2018 DOWNLOAD

post

page

attachment

revision

nav_menu_item

custom_css

customize_changeset

oembed_cache

user_request

wp_block

wp_template

wp_template_part

wp_global_styles

wp_navigation

wp_font_family

wp_font_face

acf-taxonomy

acf-post-type

acf-field-group

acf-field

ai1ec_event

exactmetrics_note

Impact of mobile technology for survivors of modern slavery and human trafficking: A mixed method study
Publications

Enabling access to online services through mobile technology is an essential need for survivors during the Covid-19 pandemic. It should be considered a feasible and necessary element of survivor support packages outside a pandemic. Further research ...Read More

What’s Changed In 10 Years?
Publications

A LOT CAN CHANGE IN A DECADE. FOR BETTER, AND FOR WORSE. Ten years ago, in the early hours of April 24, 2013, a garment factory in Dhaka, Bangladesh, crumbled. Within its walls were thousands of workers, many of whom never returned home to their ...Read More

TAGS:
‘Made in Japan’ and the cost to migrant workers
Publications

Report on migrant garment workers in Japan’s state-supported Technical Internship Training Program (TITP) are subjected to widespread labour violations including poverty pay, debt bondage, enforced overtime, and inadequate and crowded living and w...Read More

National Hotline 2017 Utah State Report
Graphics & InfographicsPublications

The data in this report represents signals and cases from January 1, 2017 through December 31, 2017 and is accurate as of July 11, 2018. Cases of trafficking may be ongoing or new information may be revealed to the National Hotline over time. Conseq...Read More