Below is the infographic for the report 
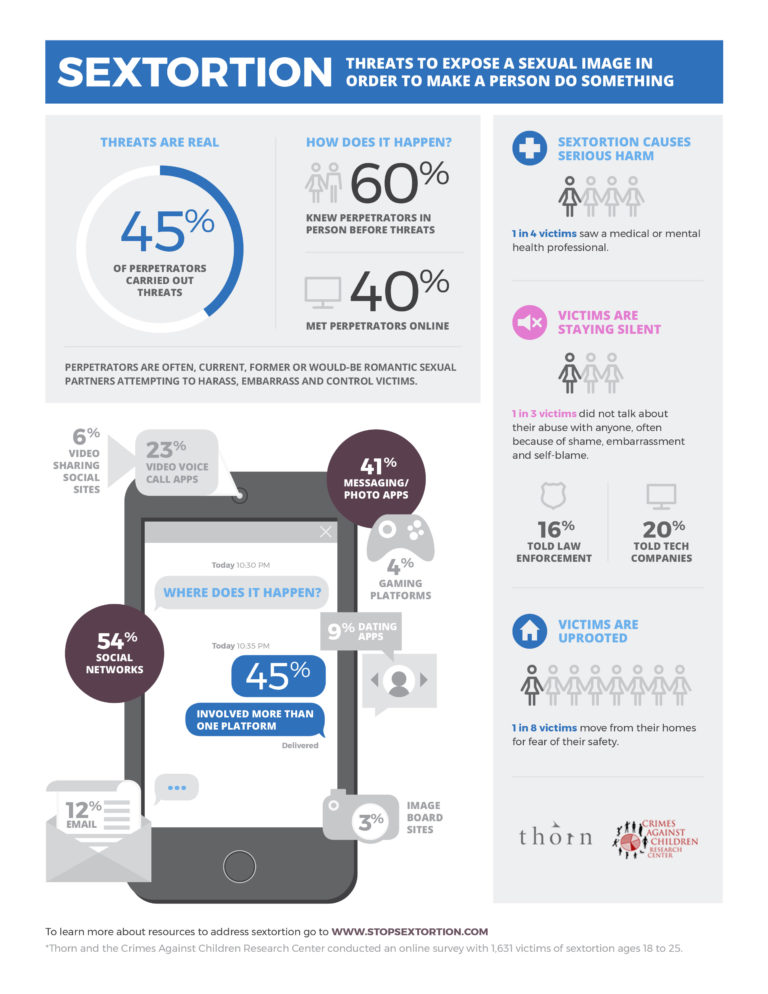
Sextortion: Findings from a Survey of 1,631 Victims, by the Crimes Against Children Research Centre and Thorn.

Sextortion: Infographic from a Survey of 1,631 Victims - Crimes Against Children Research Centre and Thorn, 2015 DOWNLOAD

post

page

attachment

revision

nav_menu_item

custom_css

customize_changeset

oembed_cache

user_request

wp_block

wp_template

wp_template_part

wp_global_styles

wp_navigation

wp_font_family

wp_font_face

acf-taxonomy

acf-post-type

acf-field-group

acf-field

ai1ec_event

exactmetrics_note

Products of Slavery (Map)
Graphics & Infographics

Products of Slavery is a data visualisation website about forced labour and child labour, also known as modern slavery, in the supply chain of many consumer goods. The site was launched by Anti-Slavery International to mark the UK’s first Anti-Slav...Read More

National Hotline 2019 Idaho State Report
Graphics & InfographicsPublications

The data in this report represents signals and cases from January 1, 2019 through December 31, 2019 and is accurate as of July 30, 2020. Cases of trafficking may be ongoing or new information may revealed to the National Hotline over time. Consequen...Read More

National Hotline 2018 Michigan State Report
Graphics & InfographicsPublications

The data in this report represents signals and cases from January 1, 2018 through December 31, 2018 and is accurate as of July 25, 2019. Cases of trafficking may be ongoing or new information may revealed to the National Hotline over time. Consequen...Read More

National Hotline 2019 Louisiana State Report
Graphics & InfographicsPublications

The data in this report represents signals and cases from January 1, 2019 through December 31, 2019 and is accurate as of July 30, 2020. Cases of trafficking may be ongoing or new information may revealed to the National Hotline over time. Consequen...Read More