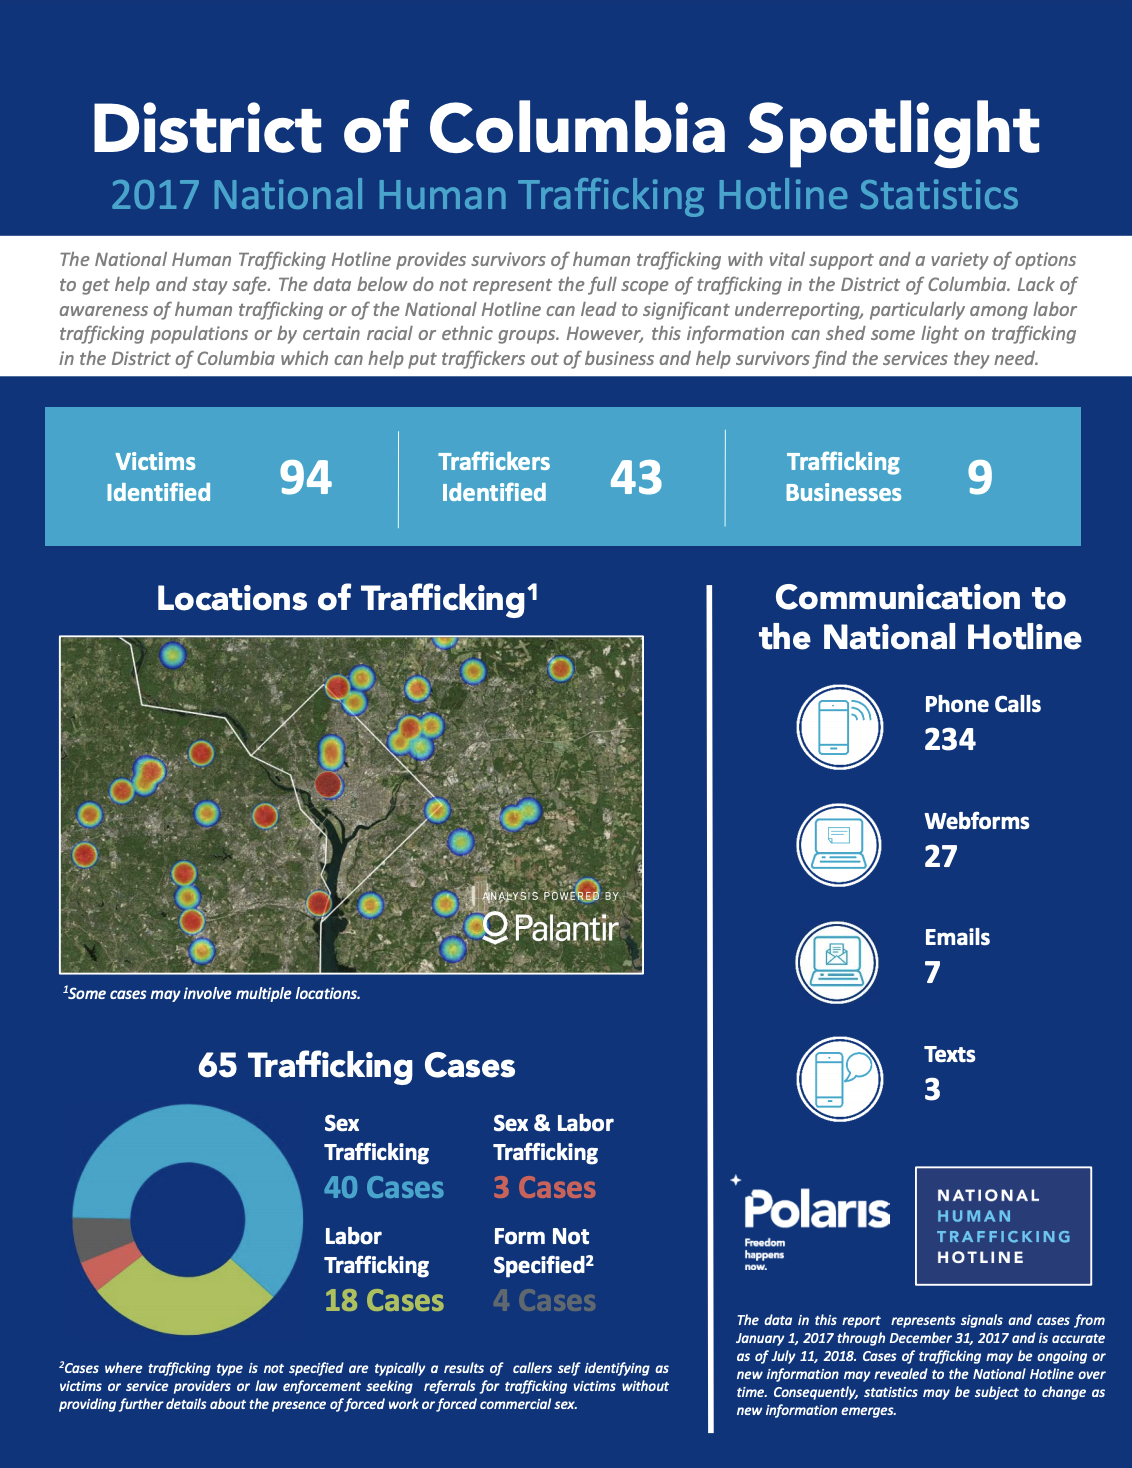
The data in this report represents signals and cases from January 1, 2017 through December 31, 2017 and is accurate as of July 11, 2018. Cases of trafficking may be ongoing or new information may be revealed to the National Hotline over time. Consequently, statistics may be subject to change as new information emerges.

You can download the report infographic below.

National Hotline 2017 District of Columbia State Report - National Human Trafficking Hotline, 2018 DOWNLOAD

post

page

attachment

revision

nav_menu_item

custom_css

customize_changeset

oembed_cache

user_request

wp_block

wp_template

wp_template_part

wp_global_styles

wp_navigation

wp_font_family

wp_font_face

acf-taxonomy

acf-post-type

acf-field-group

acf-field

ai1ec_event

exactmetrics_note

Human Trafficking 101
Publications

The slideshow below is a basic overview of human trafficking. We welcome the public to use it for educational purposes.

National Hotline 2018 Georgia State Report
Graphics & InfographicsPublications

The data in this report represents signals and cases from January 1, 2018 through December 31, 2018 and is accurate as of July 25, 2019. Cases of trafficking may be ongoing or new information may revealed to the National Hotline over time. Consequen...Read More

National Hotline 2019 Colorado State Report
Graphics & InfographicsPublications

The data in this report represents signals and cases from January 1, 2019 through December 31, 2019 and is accurate as of July 30, 2020. Cases of trafficking may be ongoing or new information may revealed to the National Hotline over time. Consequen...Read More

Developing Freedom: The Sustainable Development Case for Ending Modern Slavery, Forced Labour and Human Trafficking
Publications

40.3 million people – around 1 in every 185 people alive – experienced modern slavery or forced labour in 2016. States have committed to take immediate and effective measures to end modern slavery, forced labour and human trafficking by 2030, an...Read More