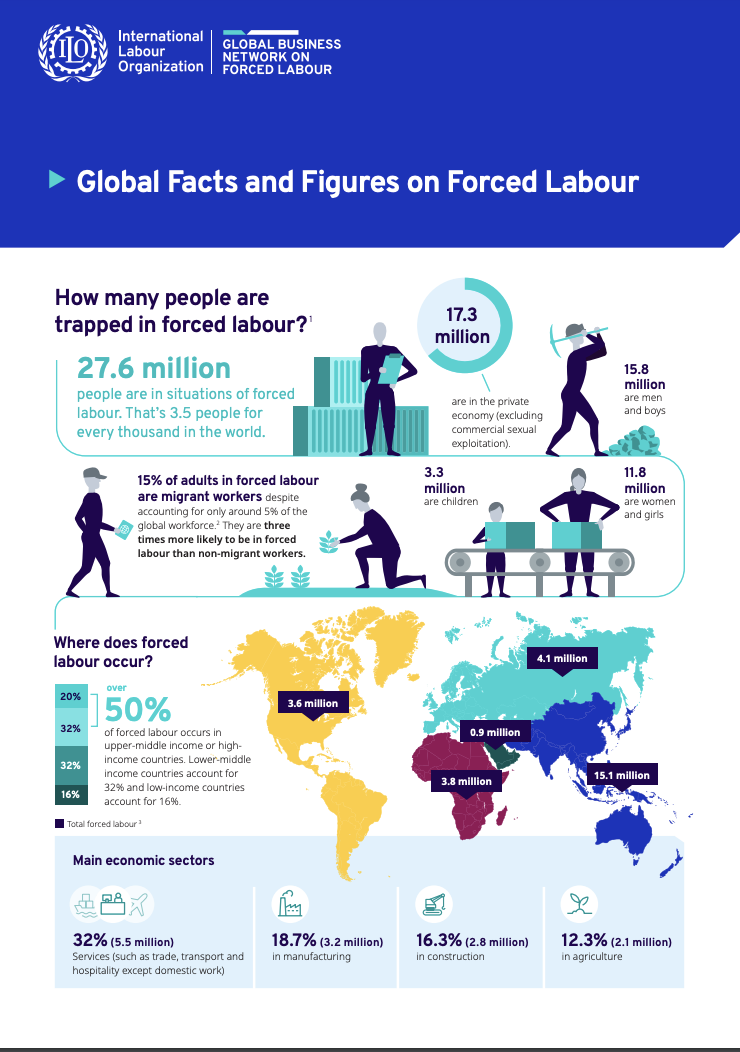
How many people are trapped in forced labour? 27.6 million people are in situations of forced labour. That’s 3.5 people for every thousand in the world.

15% of adults in forced labour are migrant workers despite accounting for only around 5% of the global workforce. They are three times more likely to be in forced labour than non-migrant workers.

Where does forced labour occur? Over 50% of forced labour occurs in upper-middle income or high-income countries. Lower-middle income countries account for 32% and low-income countries account for 16%.

How does it occur? Forced labour consists of two important elements: absence of free and informed consent (involuntariness) and presence of coercion (to prevent an individual from leaving a situation or to compel them to work). In most cases of forced labour, multiple forms are present.

Global Facts and Figures on Forced Labour - International Labour Organization, 2022 DOWNLOAD

post

page

attachment

revision

nav_menu_item

custom_css

customize_changeset

oembed_cache

user_request

wp_block

acf-field-group

acf-field

ai1ec_event

National Hotline 2018 West Virginia State Report
Graphics & InfographicsPublications

The data in this report represents signals and cases from January 1, 2018 through December 31, 2018 and is accurate as of July 25, 2019. Cases of trafficking may be ongoing or new information may revealed to the National Hotline over time. Consequen...Read More

National Hotline 2019 Louisiana State Report
Graphics & InfographicsPublications

The data in this report represents signals and cases from January 1, 2019 through December 31, 2019 and is accurate as of July 30, 2020. Cases of trafficking may be ongoing or new information may revealed to the National Hotline over time. Consequen...Read More

National Hotline 2018 Michigan State Report
Graphics & InfographicsPublications

The data in this report represents signals and cases from January 1, 2018 through December 31, 2018 and is accurate as of July 25, 2019. Cases of trafficking may be ongoing or new information may revealed to the National Hotline over time. Consequen...Read More

National Hotline 2018 Illinois State Report
Graphics & InfographicsPublications

The data in this report represents signals and cases from January 1, 2018 through December 31, 2018 and is accurate as of July 25, 2019. Cases of trafficking may be ongoing or new information may revealed to the National Hotline over time. Consequen...Read More