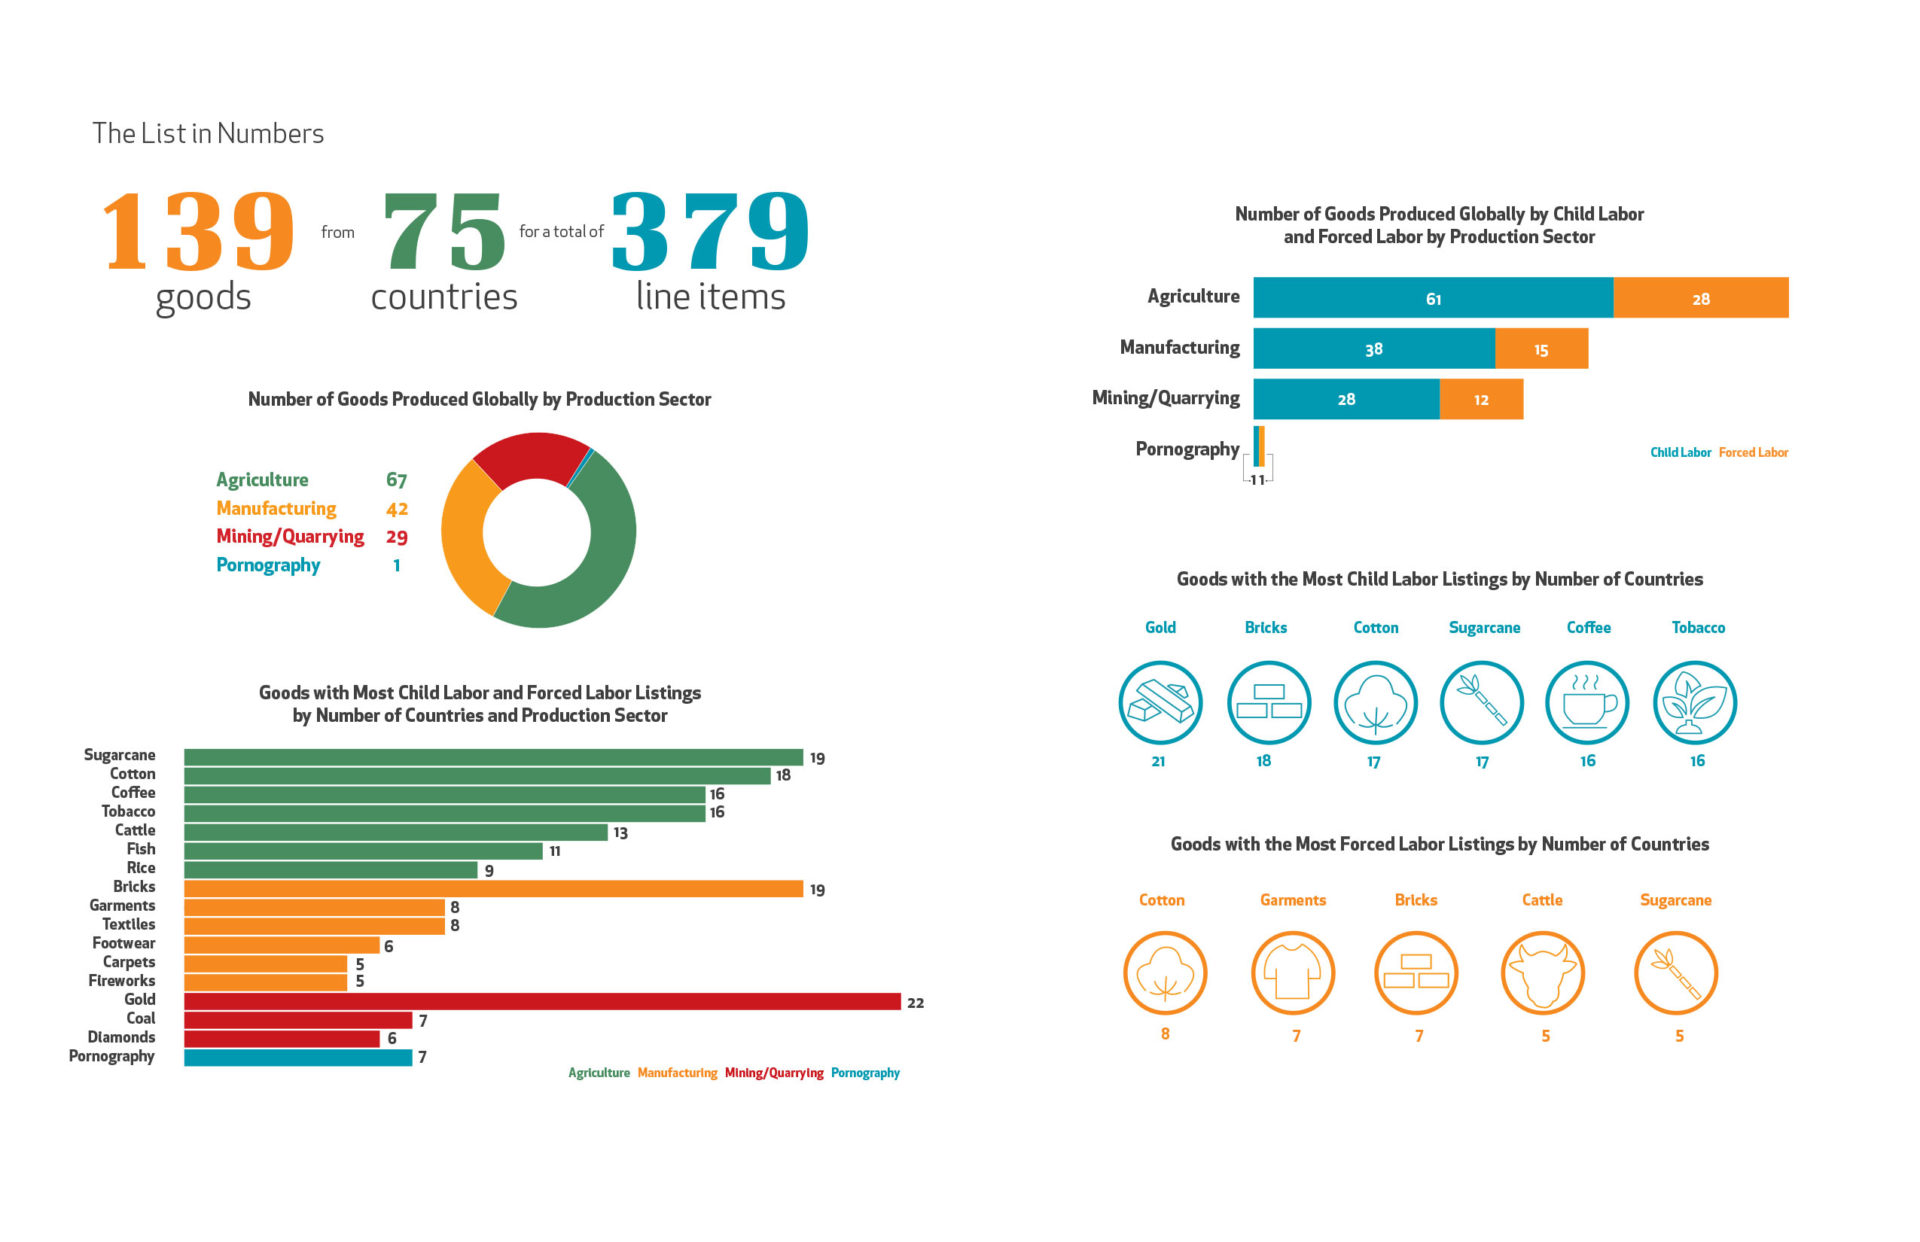
The U.S. Department of Labor’s Bureau Of International Labor Affairs (ILAB) maintains a list of goods and their source countries which it has reason to believe are produced by child labour or forced labour in violation of international standards, as required under the Trafficking Victims Protection Reauthorization Act (TVPRA) of 2005 and subsequent reauthorizations. As of September 30, 2016, the List of Goods Produced by Child Labor or Forced Labor comprises 139 goods from 75 countries.
ILAB maintains the List primarily to raise public awareness about forced labour and child labour around the world and to promote efforts to combat them; it is not intended to be punitive, but rather to serve as a catalyst for more strategic and focused coordination and cooperation among those working to address these problems.
The List is a valuable resource for researchers, advocacy organizations and companies wishing to carry out risk assessments and engage in due diligence on labour rights in their supply chains.
The countries on the List span every region of the world. The most common agricultural goods listed are cotton, sugarcane, coffee, cattle, rice, fish and cocoa. In the manufacturing sector, bricks, garments, carpets, and footwear appear most frequently; and in mined or quarried goods, diamonds, coal and gold.
ILAB released its initial TVPRA List in 2009, and updated it annually through 2014, following a set of procedural guidelines that were the product of an intensive public consultation process. ILAB now updates and publishes the List every other year, pursuant to changes in the law.
This is the seventh edition of the List of Goods Produced by Child Labor or Forced Labor, mandated by the Trafficking Victims Protection Reauthorization Act (TVPRA) of 2005 (TVPRA List). The list has a total of 139 goods produced by...
The data in this report represents signals and cases from January 1, 2017 through December 31, 2017 and is accurate as of July 11, 2018. Cases of trafficking may be ongoing or new information may be revealed to the National Hotline over time. Conseq...Read More
The data in this report represents signals and cases from January 1, 2018 through December 31, 2018 and is accurate as of July 25, 2019. Cases of trafficking may be ongoing or new information may revealed to the National Hotline over time. Consequen...Read More
The data in this report represents signals and cases from January 1, 2018 through December 31, 2018 and is accurate as of July 25, 2019. Cases of trafficking may be ongoing or new information may revealed to the National Hotline over time. Consequen...Read More
The data in this report represents signals and cases from January 1, 2018 through December 31, 2018 and is accurate as of July 25, 2019. Cases of trafficking may be ongoing or new information may revealed to the National Hotline over time. Consequen...Read More