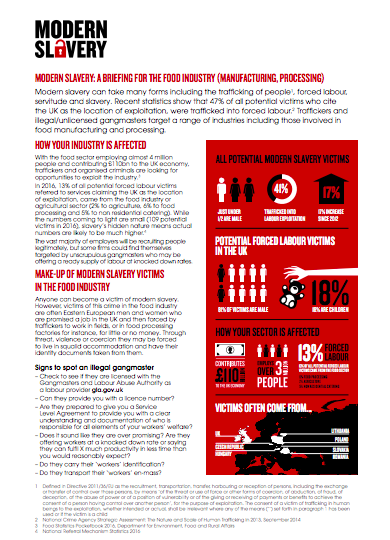
Modern slavery can take many forms including the trafficking of people, forced labour, servitude and slavery. Recent statistics show that 47% of all potential victims who cite the UK as the location of exploitation, were trafficked into forced labour. Traffickers and illegal/ unlicensed gangmasters target a range of industries including those involved in food manufacturing and processing.

How Your Industry Is Affected

With the food sector employing almost 4 million people and contributing £110bn to the UK economy, traffickers and organised criminals are looking for opportunities to exploit the industry. In 2016, 13% of all potential forced labour victims referred to services claiming the UK as the location of exploitation, came from the food industry or agricultural sector (2% to agriculture, 6% to food processing and 5% to non residential catering). While the numbers coming to light are small (109 potential victims in 2016), slavery’s hidden nature means actual numbers are likely to be much higher. The vast majority of employers will be recruiting people legitimately, but some firms could find themselves targeted by unscrupulous gangmasters who may be offering a ready supply of labour at knocked down rates.

Factsheet, Modern Slavery: A Briefing for the Food Industry (Manufacturing, Processing) DOWNLOAD

post

page

attachment

revision

nav_menu_item

custom_css

customize_changeset

oembed_cache

user_request

wp_block

acf-field-group

acf-field

ai1ec_event

National Hotline 2018 Rhode Island State Report
Graphics & InfographicsPublications

The data in this report represents signals and cases from January 1, 2018 through December 31, 2018 and is accurate as of July 25, 2019. Cases of trafficking may be ongoing or new information may revealed to the National Hotline over time. Consequen...Read More

Design of a Privacy-Preserving Data Platform for Collaboration Against Human Trafficking
News & AnalysisGuidanceGood PracticesGraphics & Infographics

Case records on identified victims of human trafficking are highly sensitive, yet the ability to share such data is critical to evidence-based practice and policy development across government, business, and civil society. We propose new methods to...Read More

National Hotline 2018 Connecticut State Report
Graphics & InfographicsPublications

The data in this report represents signals and cases from January 1, 2018 through December 31, 2018 and is accurate as of July 25, 2019. Cases of trafficking may be ongoing or new information may revealed to the National Hotline over time. Consequen...Read More

Human Trafficking: What Disaster Responders Need to Know
GuidanceGraphics & Infographics

Studies have shown that even outside of a disaster context, approximately 50% of individuals who have been trafficked saw a health professional while being trafficked. However, first responders are rarely trained to recognize these patients, despite...Read More