Modern slavery can take many forms including the trafficking of people, forced labour, servitude and slavery. Recent statistics show that 47% of all potential victims who cite the UK as the location of exploitation, were trafficked into forced labour. Traffickers and illegal/ unlicensed gangmasters target a range of industries including those involved in fisheries.

The Fishing industry and the people it employs landed £775 million worth of fish into the UK and abroad in 2015. Over 12,000 fishermen were active in the UK. 4 cases of modern slavery in the UK’s fishing industry were identified in 2016. While the numbers coming to light are small, slavery’s hidden nature means actual numbers are likely to be much higher. While the vast majority of captains/skippers will be recruiting fisherman legitimately, some could find themselves targeted by unscrupulous gangmasters who may be offering a ready supply of labour at knocked down rates or getting cheap labour from ships in international waters.

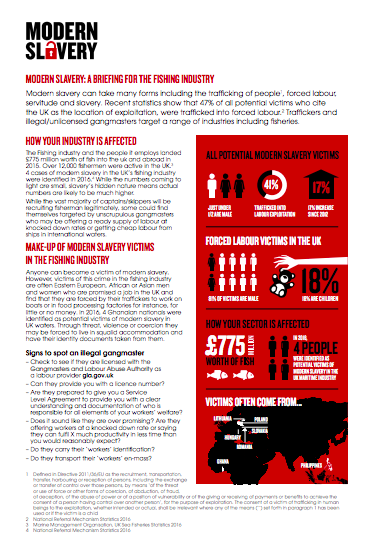
Fishing industry factsheet, Modern Slavery factsheet: A Briefing DOWNLOAD

post

page

attachment

revision

nav_menu_item

custom_css

customize_changeset

oembed_cache

user_request

wp_block

acf-field-group

acf-field

ai1ec_event

National Hotline 2019 Minnesota State Report
Graphics & InfographicsPublications

The data in this report represents signals and cases from January 1, 2019 through December 31, 2019 and is accurate as of July 30, 2020. Cases of trafficking may be ongoing or new information may revealed to the National Hotline over time. Consequen...Read More

National Hotline 2018 Florida State Report
Graphics & InfographicsPublications

The data in this report represents signals and cases from January 1, 2018 through December 31, 2018 and is accurate as of July 25, 2019. Cases of trafficking may be ongoing or new information may revealed to the National Hotline over time. Consequen...Read More

National Hotline 2017 Kentucky State Report
Graphics & InfographicsPublications

The data in this report represents signals and cases from January 1, 2017 through December 31, 2017 and is accurate as of July 11, 2018. Cases of trafficking may be ongoing or new information may be revealed to the National Hotline over time. Conseq...Read More

National Hotline 2018 Michigan State Report
Graphics & InfographicsPublications

The data in this report represents signals and cases from January 1, 2018 through December 31, 2018 and is accurate as of July 25, 2019. Cases of trafficking may be ongoing or new information may revealed to the National Hotline over time. Consequen...Read More