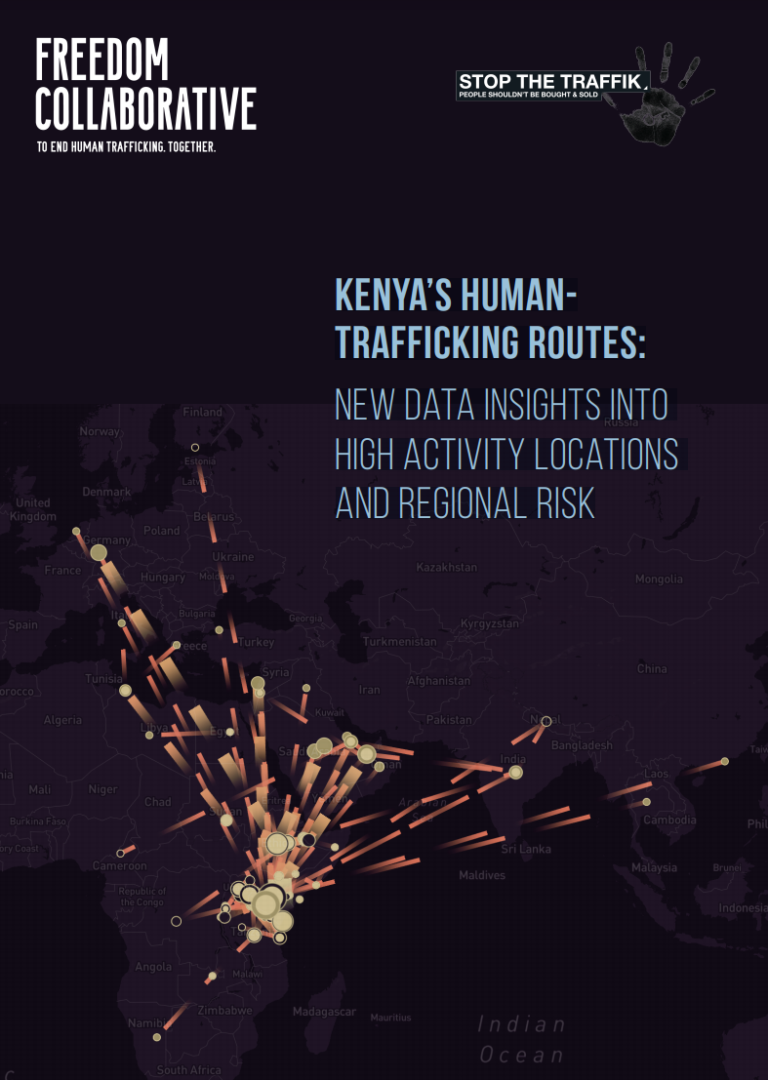
This report provides an analysis of the data collected, maps specific migration corridors in which organizations have encountered a high number of cases of exploitation, and analyses ways in which the data can be used to build influence and cooperation in collaboration with relevant stakeholders and government agencies. For the purposes of clarity, the report is divided into individual sections that summarize the data findings along regional lines, and also includes chapters focused on identified transportation and airlines used, as well as methods of recruitment and
coercion.

Kenya’s Human Trafficking Routes: New Data Insights into High Activity Locations and Regional Risk - Freedom Collaborative, 2020 DOWNLOAD

post

page

attachment

revision

nav_menu_item

custom_css

customize_changeset

oembed_cache

user_request

wp_block

wp_template

wp_template_part

wp_global_styles

wp_navigation

wp_font_family

wp_font_face

acf-taxonomy

acf-post-type

acf-field-group

acf-field

ai1ec_event

exactmetrics_note

Modern Slavery in Pacific Supply Chains of Canned Tuna
Publications

Between November 2018 and January 2019, Business & Human Rights Resource Centre invited 35 canned tuna companies and supermarkets - representing 80 of the world’s largest retail canned tuna brands - to answer a survey on their approach to hu...Read More

The Impact of COVID-19 on children
COVID-19 resourcesPublications

Children are not the face of this pandemic. But they risk being among its biggest victims. While they have thankfully been largely spared from the direct health effects of COVID-19 - at least to date – the crisis is having a profound effect on the...Read More

TAGS: Global
National Hotline 2017 Utah State Report
Graphics & InfographicsPublications

The data in this report represents signals and cases from January 1, 2017 through December 31, 2017 and is accurate as of July 11, 2018. Cases of trafficking may be ongoing or new information may be revealed to the National Hotline over time. Conseq...Read More

National Hotline 2017 Maryland State Report
Graphics & InfographicsPublications

The data in this report represents signals and cases from January 1, 2017 through December 31, 2017 and is accurate as of July 11, 2018. Cases of trafficking may be ongoing or new information may be revealed to the National Hotline over time. Conseq...Read More