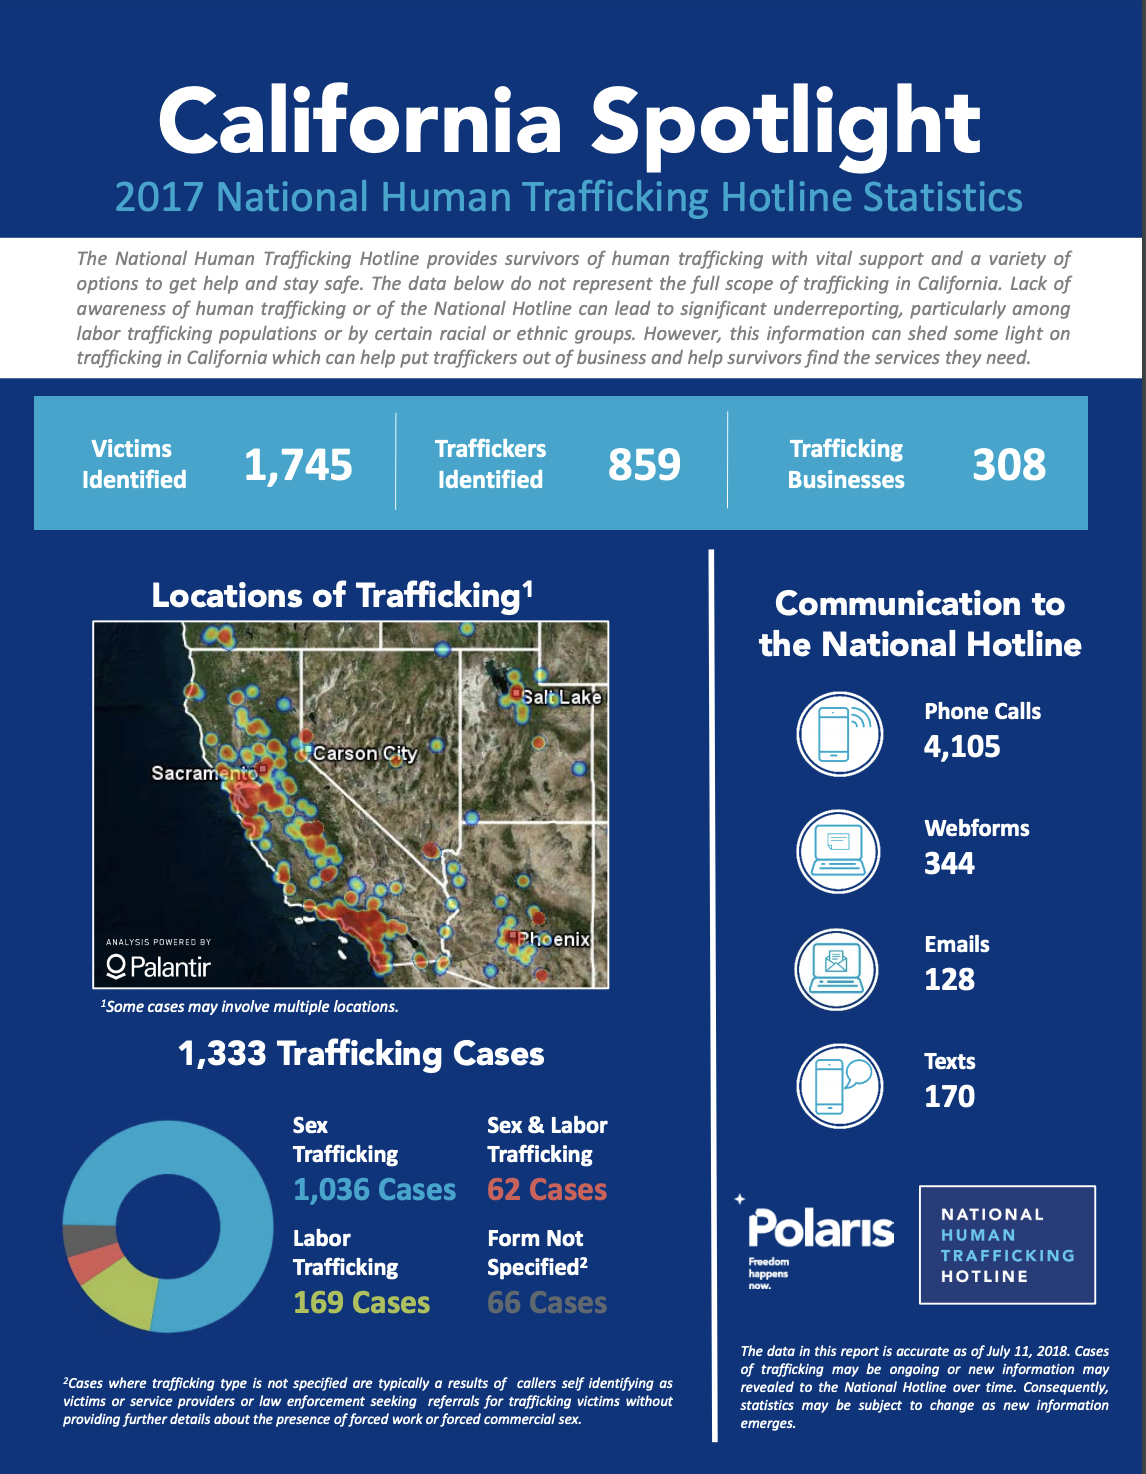
The data in this report represents signals and cases from January 1, 2017 through December 31, 2017 and is accurate as of July 11, 2018. Cases of trafficking may be ongoing or new information may be revealed to the National Hotline over time. Consequently, statistics may be subject to change as new information emerges.

You can download the full report infographic below.

National Hotline 2017 California State Report - National Human Trafficking Hotline, 2018 DOWNLOAD

post

page

attachment

revision

nav_menu_item

custom_css

customize_changeset

oembed_cache

user_request

wp_block

acf-field-group

acf-field

ai1ec_event

The Effects of COVID‑19 on Trade and Global Supply Chains
COVID-19 resourcesPublications

The purpose of this brief is to provide an analysis of the near-term effects of the COVID‑19 pandemic on enterprises and workers engaged in trade and GSC-related activities and to explore the medium and long-term implications of the pandemic on su...Read More

National Hotline 2017 Ohio State Report
Graphics & InfographicsPublications

The data in this report represents signals and cases from January 1, 2017 through December 31, 2017 and is accurate as of July 11, 2018. Cases of trafficking may be ongoing or new information may be revealed to the National Hotline over time. Conseq...Read More

NetClean Report 2018
Publications

The 2018 report by NetClean looks at police officers’ experiences and perspectives of self-produced material, organised offenders, obfuscation techniques, cryptocurrencies and deepfakes; as well as at employers’ experiences and perspectives ...Read More

National Hotline 2017 New Hampshire State Report
Graphics & InfographicsPublications

The data in this report represents signals and cases from January 1, 2017 through December 31, 2017 and is accurate as of July 11, 2018. Cases of trafficking may be ongoing or new information may be revealed to the National Hotline over time. Conseq...Read More