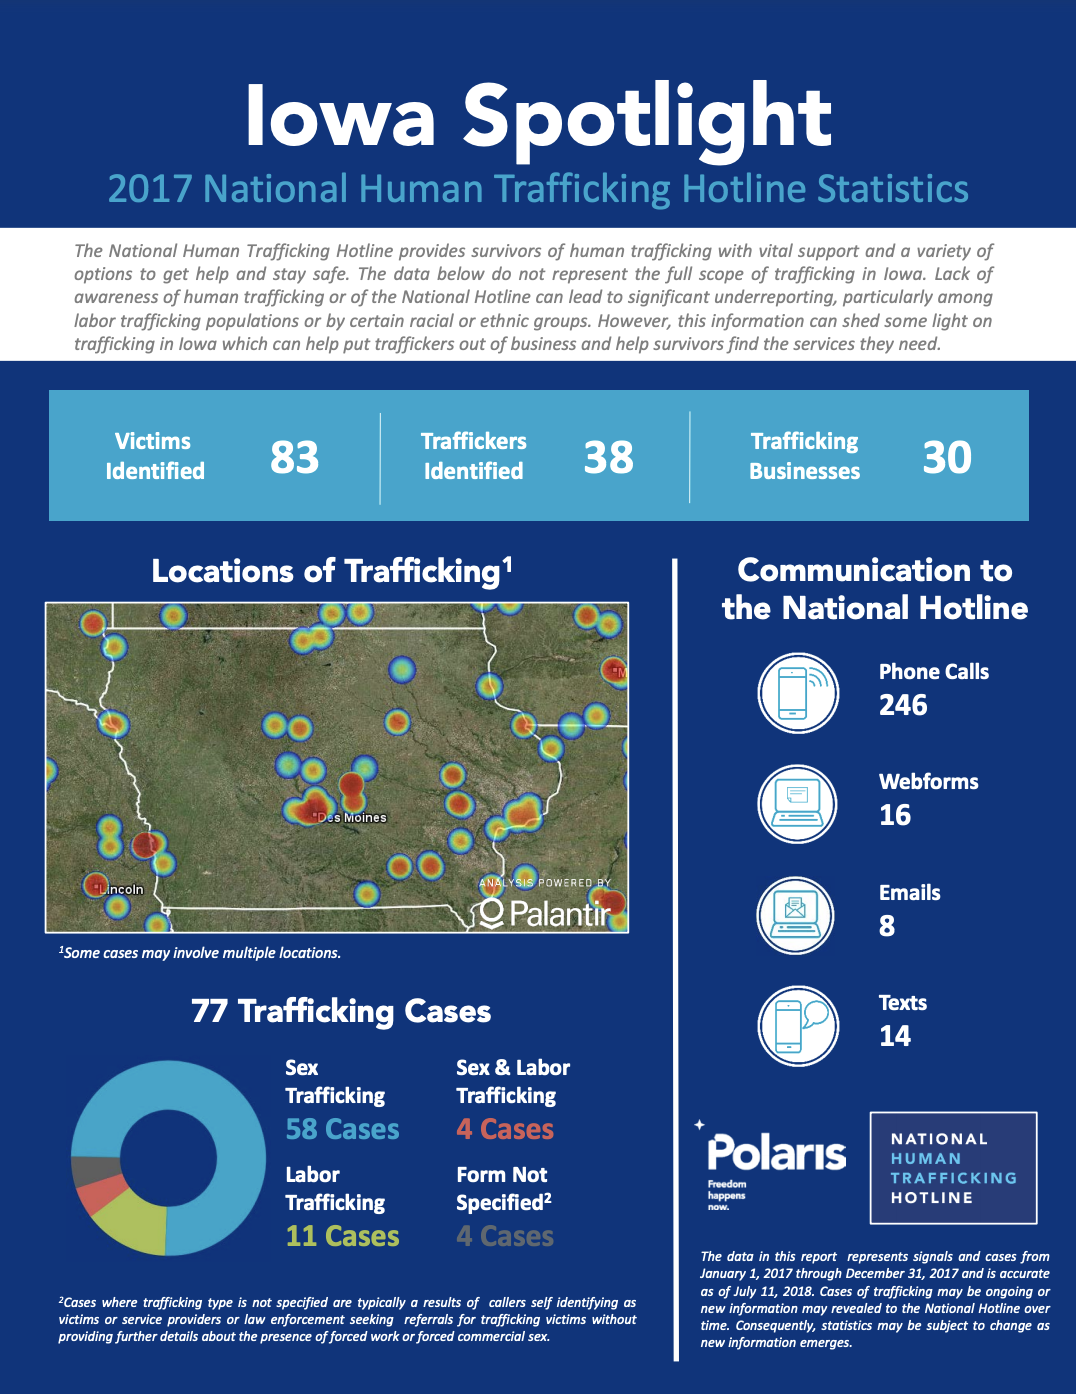
The data in this report represents signals and cases from January 1, 2017 through December 31, 2017 and is accurate as of July 11, 2018. Cases of trafficking may be ongoing or new information may be revealed to the National Hotline over time. Consequently, statistics may be subject to change as new information emerges.

You can download the report infographic below.

National Hotline 2017 Iowa State Report - National Human Trafficking Hotline, 2018 DOWNLOAD

post

page

attachment

revision

nav_menu_item

custom_css

customize_changeset

oembed_cache

user_request

wp_block

wp_template

wp_template_part

wp_global_styles

wp_navigation

wp_font_family

wp_font_face

acf-taxonomy

acf-post-type

acf-field-group

acf-field

ai1ec_event

exactmetrics_note

Sextortion: Infographic from a Survey of 1,631 Victims
Graphics & Infographics

Below is the infographic for the report Sextortion: Findings from a Survey of 1,631 Victims, by the Crimes Against Children Research Centre and Thorn. ...Read More

No Worker Left Behind: Protecting Vulnerable Workers From Exploitation During and After the Coronavirus (COVID-19) Pandemic
COVID-19 resourcesPublications

This briefing examines the impact of the Coronavirus pandemic on the risk of labour exploitation in low-paid and insecure employment in the UK. Drawing on interviews with workers and frontline services, it proposes emergency measures to ensure all w...Read More

TAGS: Europe
National Hotline 2019 Oregon State Report
Graphics & InfographicsPublications

The data in this report represents signals and cases from January 1, 2019 through December 31, 2019 and is accurate as of July 30, 2020. Cases of trafficking may be ongoing or new information may revealed to the National Hotline over time. Consequen...Read More

Global Slavery Index 2018 – Infographics
Graphics & Infographics

Below are the infographics of Walk Free Foundation's Global Slavery Index 2018. ...Read More

TAGS: Global