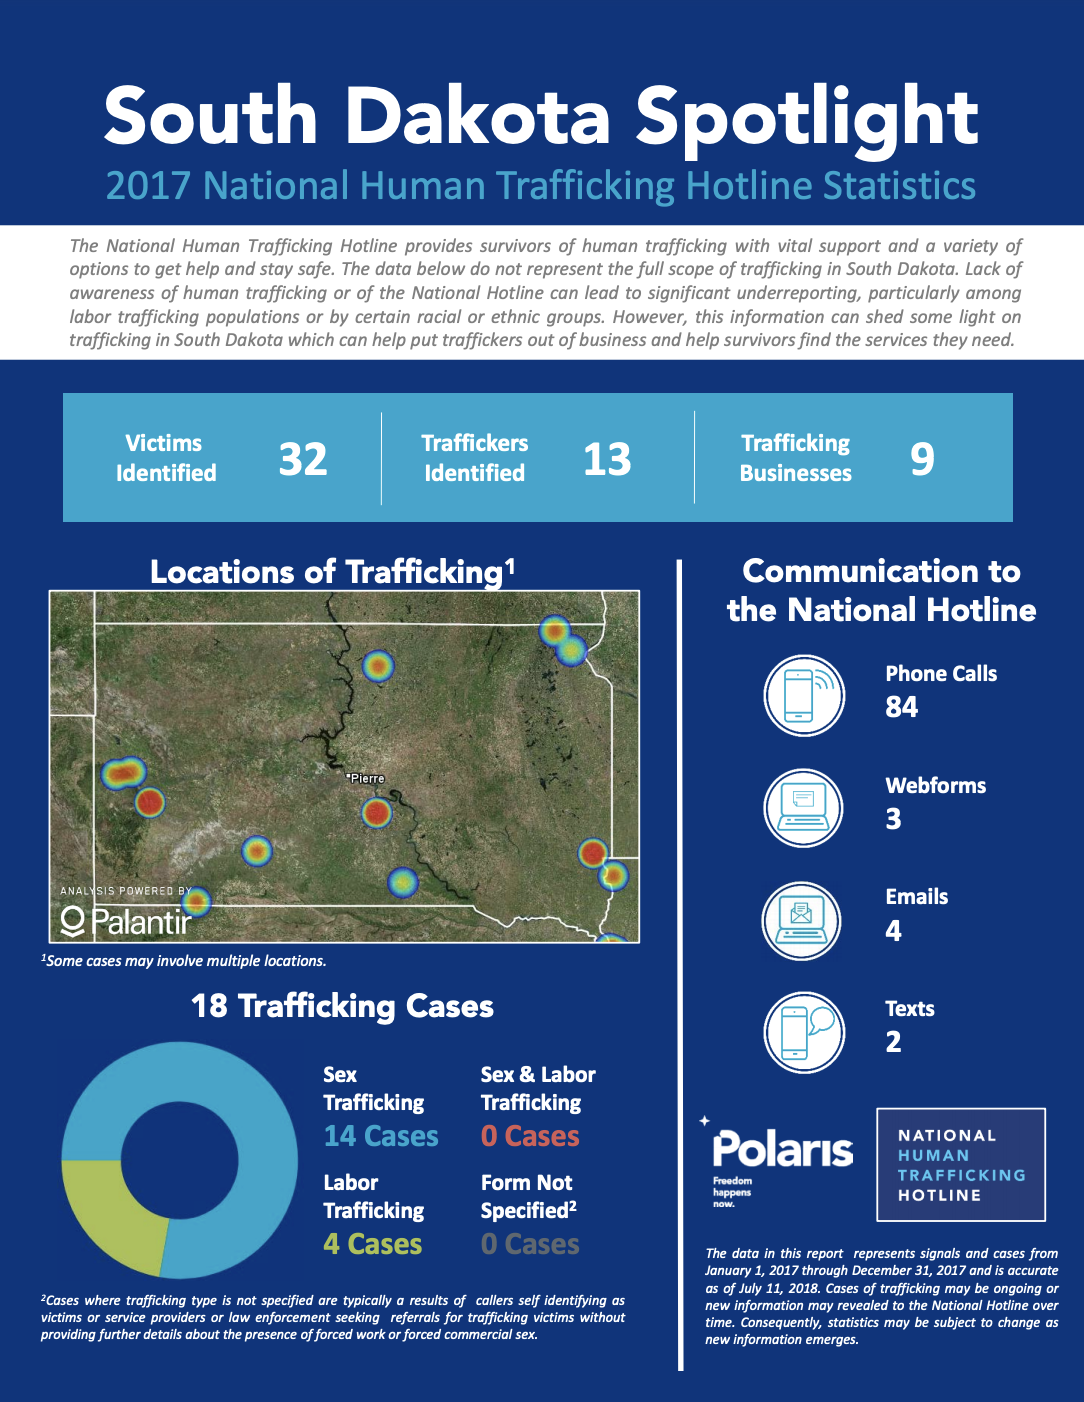
The data in this report represents signals and cases from January 1, 2017 through December 31, 2017 and is accurate as of July 11, 2018. Cases of trafficking may be ongoing or new information may be revealed to the National Hotline over time. Consequently, statistics may be subject to change as new information emerges.

You can download the report infographic below.

National Hotline 2017 South Dakota State Report - National Human Trafficking Hotline, 2018 DOWNLOAD

post

page

attachment

revision

nav_menu_item

custom_css

customize_changeset

oembed_cache

user_request

wp_block

acf-field-group

acf-field

ai1ec_event

Liability of Social Auditors in the Textile Industry
Publications

The„ expansion„ of„ the „social„ audit„ industry „exemplifies „the „neoliberal „culture „of „private„ and „voluntary „codes „of „conduct „in „combination „with „the „privatization„ of „inspections.„„„Over-reliance „on...Read More

ITUC Global Rights Index
Graphics & InfographicsPublications

The breakdown of the social contract is exposed in the 2020 ITUC Global Rights Index with violations of workers’ rights at a seven-year high. The trends by governments and employers to restrict the rights of workers through violations of collecti...Read More

The Behind the Brands: Food Companies Scorecard
Publications

The Behind the Brands Scorecard assesses the agricultural sourcing policies of the world's ten largest food and beverage companies. It exclusively focuses on publicly available informa- tion that relates to the policies of these companies on their so...Read More

National Hotline 2019 Vermont State Report
Graphics & InfographicsPublications

The data in this report represents signals and cases from January 1, 2019 through December 31, 2019 and is accurate as of July 30, 2020. Cases of trafficking may be ongoing or new information may revealed to the National Hotline over time. Consequen...Read More