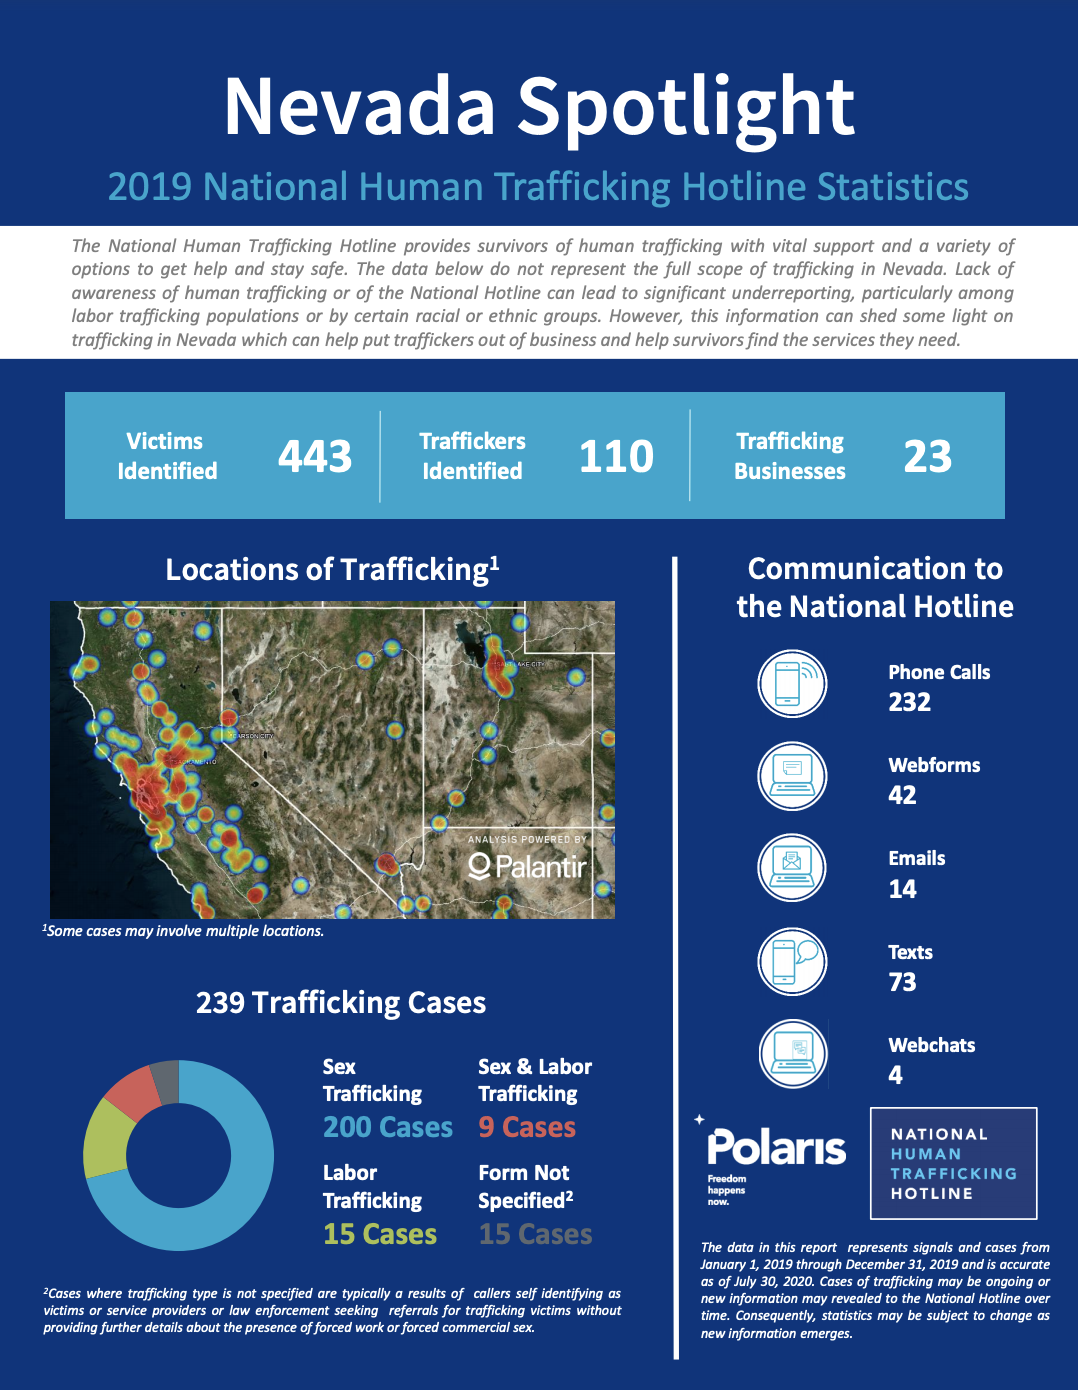
The data in this report represents signals and cases from January 1, 2019 through December 31, 2019 and is accurate as of July 30, 2020. Cases of trafficking may be ongoing or new information may revealed to the National Hotline over time. Consequently, statistics may be subject to change as new information emerges.

You can download the report infographic below.

National Hotline 2019 Nevada State Report - National Human Trafficking Hotline, 2020 DOWNLOAD

post

page

attachment

revision

nav_menu_item

custom_css

customize_changeset

oembed_cache

user_request

wp_block

wp_template

wp_template_part

wp_global_styles

wp_navigation

wp_font_family

wp_font_face

acf-taxonomy

acf-post-type

acf-field-group

acf-field

ai1ec_event

exactmetrics_note

National Hotline 2019 California State Report
Graphics & InfographicsPublications

The data in this report represents signals and cases from January 1, 2019 through December 31, 2019 and is accurate as of July 30, 2020. Cases of trafficking may be ongoing or new information may revealed to the National Hotline over time. Consequen...Read More

National Hotline 2018 Alaska State Report
Graphics & InfographicsPublications

The data in this report represents signals and cases from January 1, 2018 through December 31, 2018 and is accurate as of July 25, 2019. Cases of trafficking may be ongoing or new information may revealed to the National Hotline over time. Consequen...Read More

Assessing forced labour risks in the palm oil sector in Indonesia and Malaysia
Publications

This report highlights the critical role the Consumer Goods Forum (CGF) can play in mitigating forced labour risks in the production of palm oil by leveraging its industry leadership to spur the collective action of its members. There is strong int...Read More

Lessons from the Survivor Inclusion Initiative (SII) in the UK, US, and Canada
GuidanceGood PracticesPublications

To find out more about how the SII has been experienced, the Expert Review gathered information from two surveys and 10 interviews with key stakeholders. There were 14 SSO (all US-based) and 10 FI survey respondents (seven US, two Canada, and on...Read More