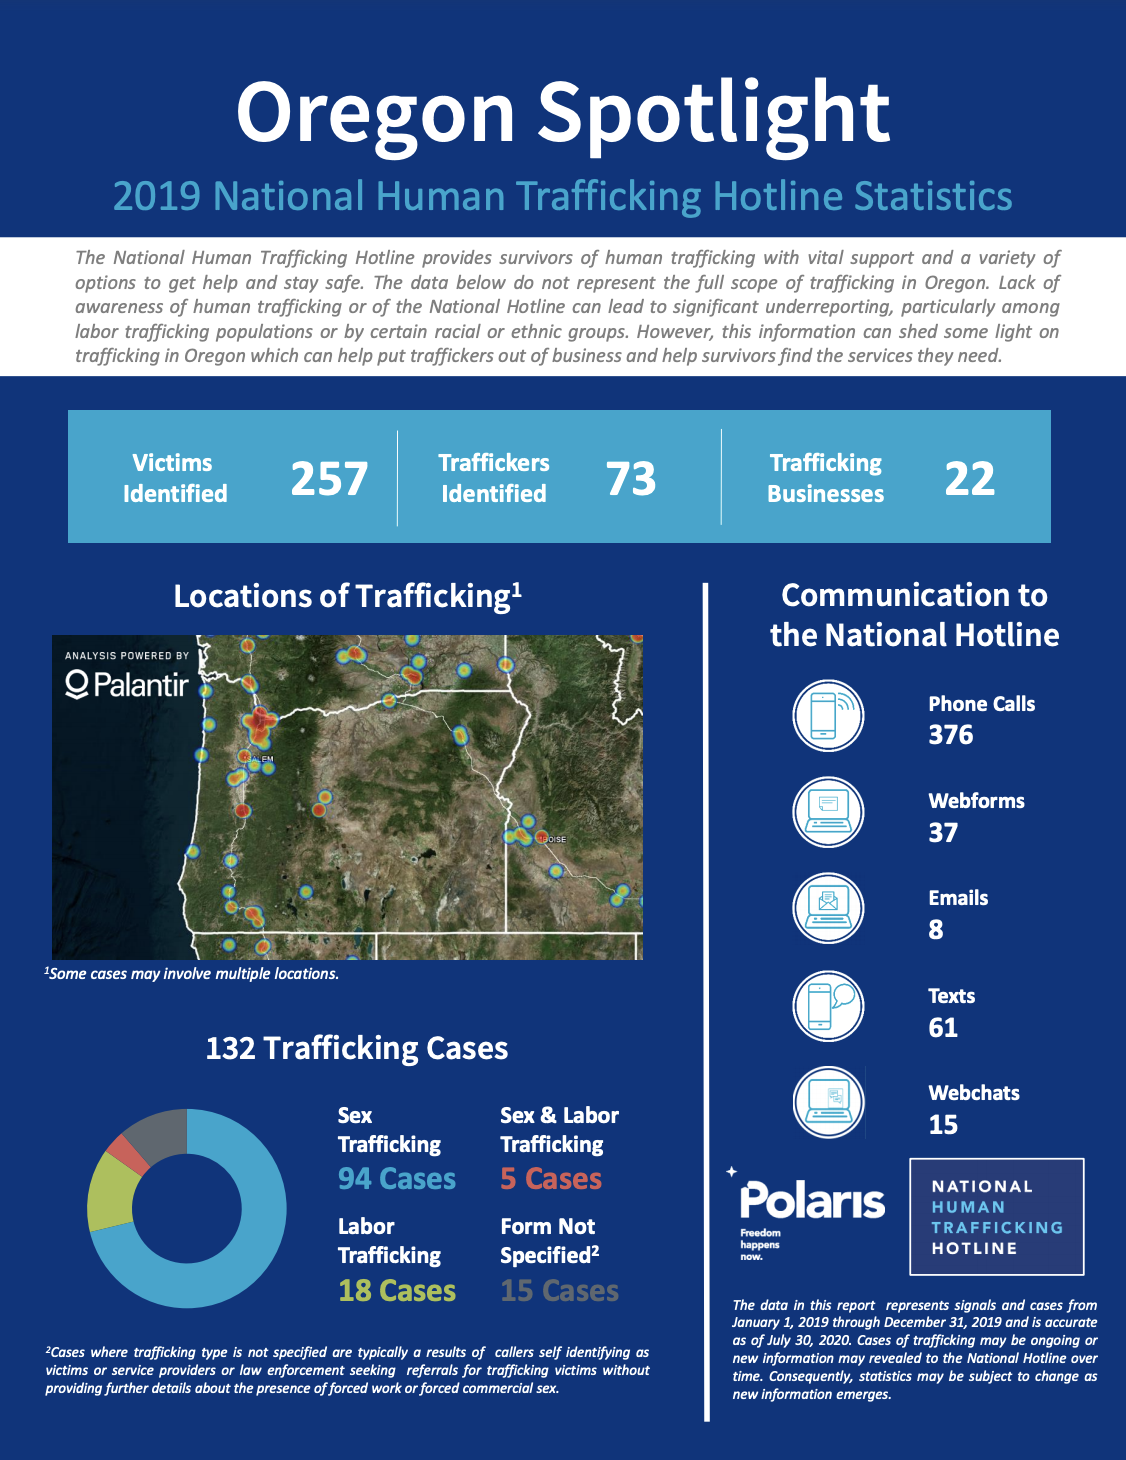
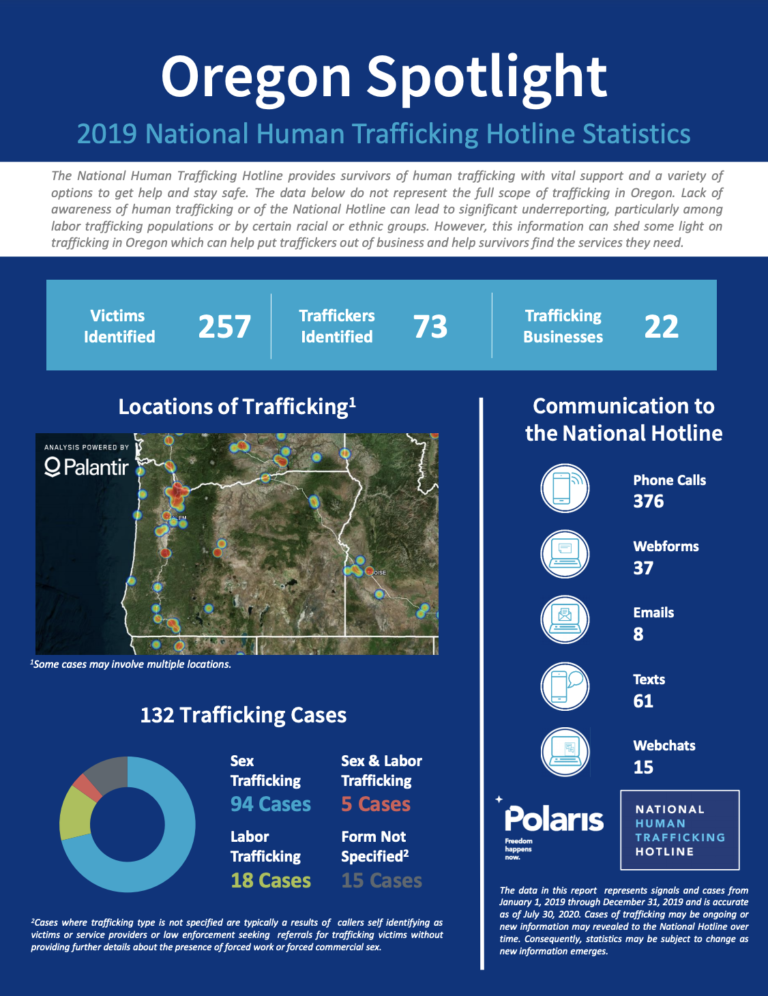
The data in this report represents signals and cases from January 1, 2019 through December 31, 2019 and is accurate as of July 30, 2020. Cases of trafficking may be ongoing or new information may revealed to the National Hotline over time. Consequently, statistics may be subject to change as new information emerges.

You can download the report infographic below.

National Hotline 2019 Oregon State Report - National Human Trafficking Hotline, 2020 DOWNLOAD

post

page

attachment

revision

nav_menu_item

custom_css

customize_changeset

oembed_cache

user_request

wp_block

acf-field-group

acf-field

ai1ec_event

One year to Expo 2020: A Snapshot of UAE Construction Sector and Risks to Vulnerable Workers
Publications

The Expo 2020 will see an estimated 25 million people visit Dubai as the UAE showcases itself to the world. Yet 12 months ahead of the Expo’s launch, migrant workers on UAE construction sites continue to suffer exploitation and...Read More

National Hotline 2018 Nevada State Report
Graphics & InfographicsPublications

The data in this report represents signals and cases from January 1, 2018 through December 31, 2018 and is accurate as of July 25, 2019. Cases of trafficking may be ongoing or new information may revealed to the National Hotline over time. Consequen...Read More

Know Your Rights
Graphics & Infographics

An infographic made available by ECPAT to inform children victims of sexual abuses about their rights and how to exercise them.

TAGS: Global
Understanding and Advancing Empowered Worker Voice
GuidanceGraphics & Infographics

Over the past several months, in Issara's ongoing engagement with brands and retailers, business associations, and environmental sustainability colleagues, Issara has been asked many times what worker voice is. It is widely observed at this point t...Read More

TAGS: Global