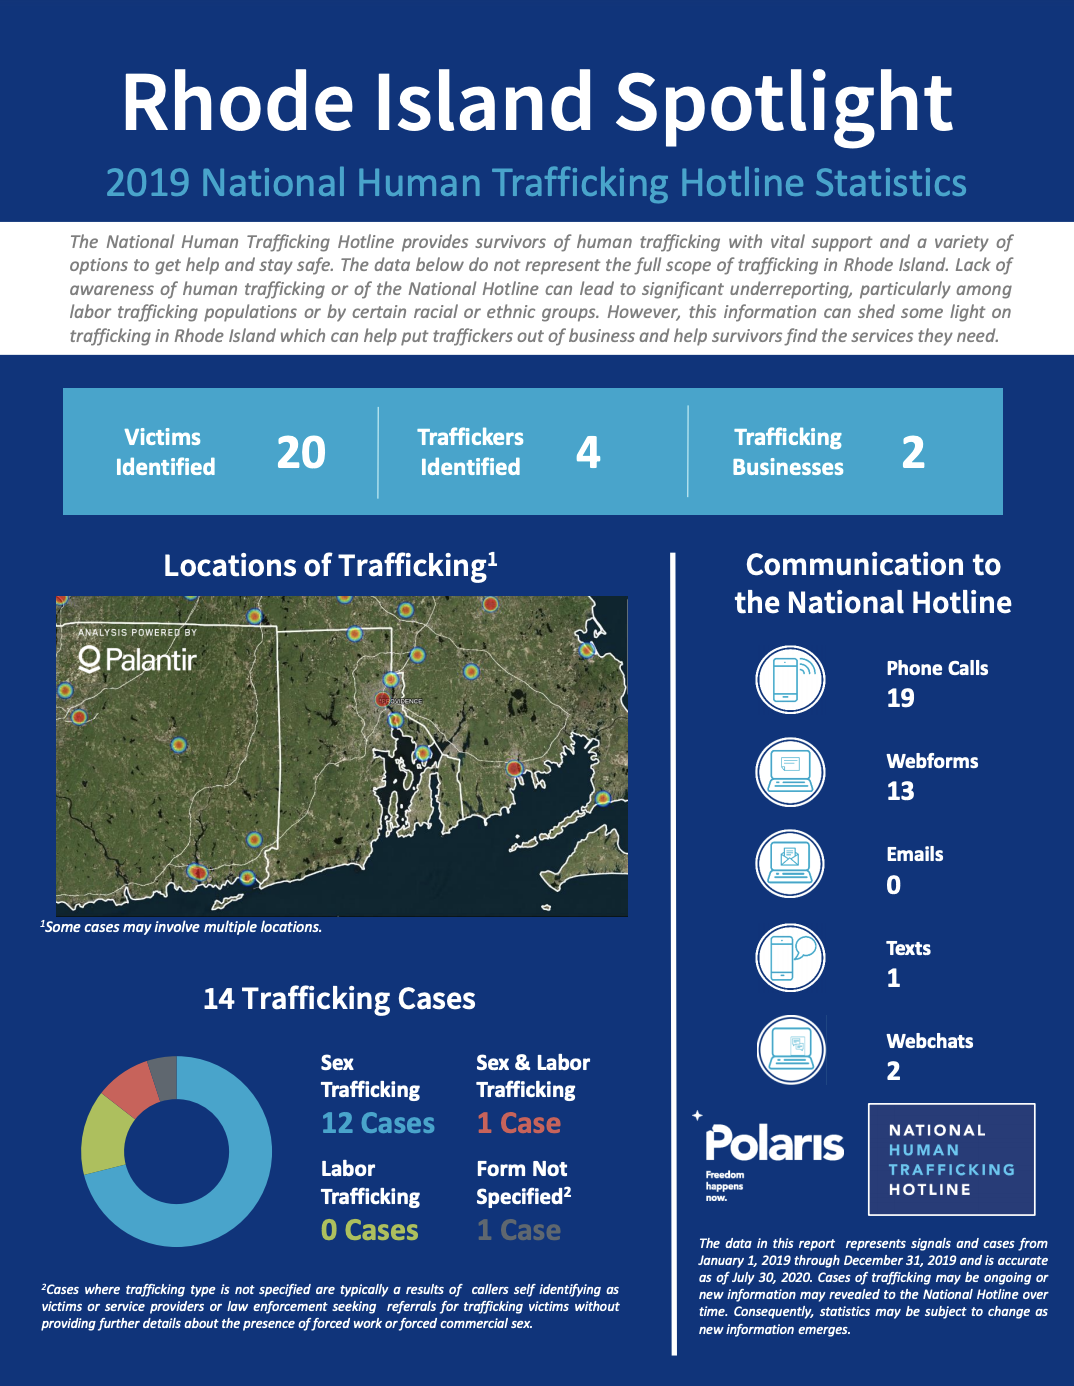
The data in this report represents signals and cases from January 1, 2019 through December 31, 2019 and is accurate as of July 30, 2020. Cases of trafficking may be ongoing or new information may revealed to the National Hotline over time. Consequently, statistics may be subject to change as new information emerges.

You can download the report infographic below.

National Hotline 2019 Rhode Island State Report - National Human Trafficking Hotline, 2020 DOWNLOAD

post

page

attachment

revision

nav_menu_item

custom_css

customize_changeset

oembed_cache

user_request

wp_block

wp_template

wp_template_part

wp_global_styles

wp_navigation

wp_font_family

wp_font_face

acf-taxonomy

acf-post-type

acf-field-group

acf-field

ai1ec_event

exactmetrics_note

Rapid Assessment on Child Domestic Work in Myanmar
Publications

The report gives an overview of the situation of children workers in Myanmar in the domestic work sector.

ITUC Global Rights Index 2018: The World’s Worst Countries for Workers (Map)
Graphics & Infographics

This infographic shows the world's map and rating of the 2018 ITUC Global Rights Index, which depicts the world’s worst countries for workers by rating 142 countries on a scale from 1-5 based on the degree of respect for workers’ rights with 1 be...Read More

TAGS: Global
Understanding Modern Slavery
Graphics & Infographics

Modern Slavery refers to situations where one person has taken away another person's freedom - their freedom to choose to refuse certain work or to stop working - so that they can be exploited. Freedom is taken away by threats, violence, coercio...Read More

TAGS: Global
National Hotline 2019 New York State Report
Graphics & InfographicsPublications

The data in this report represents signals and cases from January 1, 2019 through December 31, 2019 and is accurate as of July 30, 2020. Cases of trafficking may be ongoing or new information may revealed to the National Hotline over time. Consequen...Read More