These graphics summarise the findings of the 2012 International Labour Organization’s (ILO) report Global Estimate of Forced Labour.
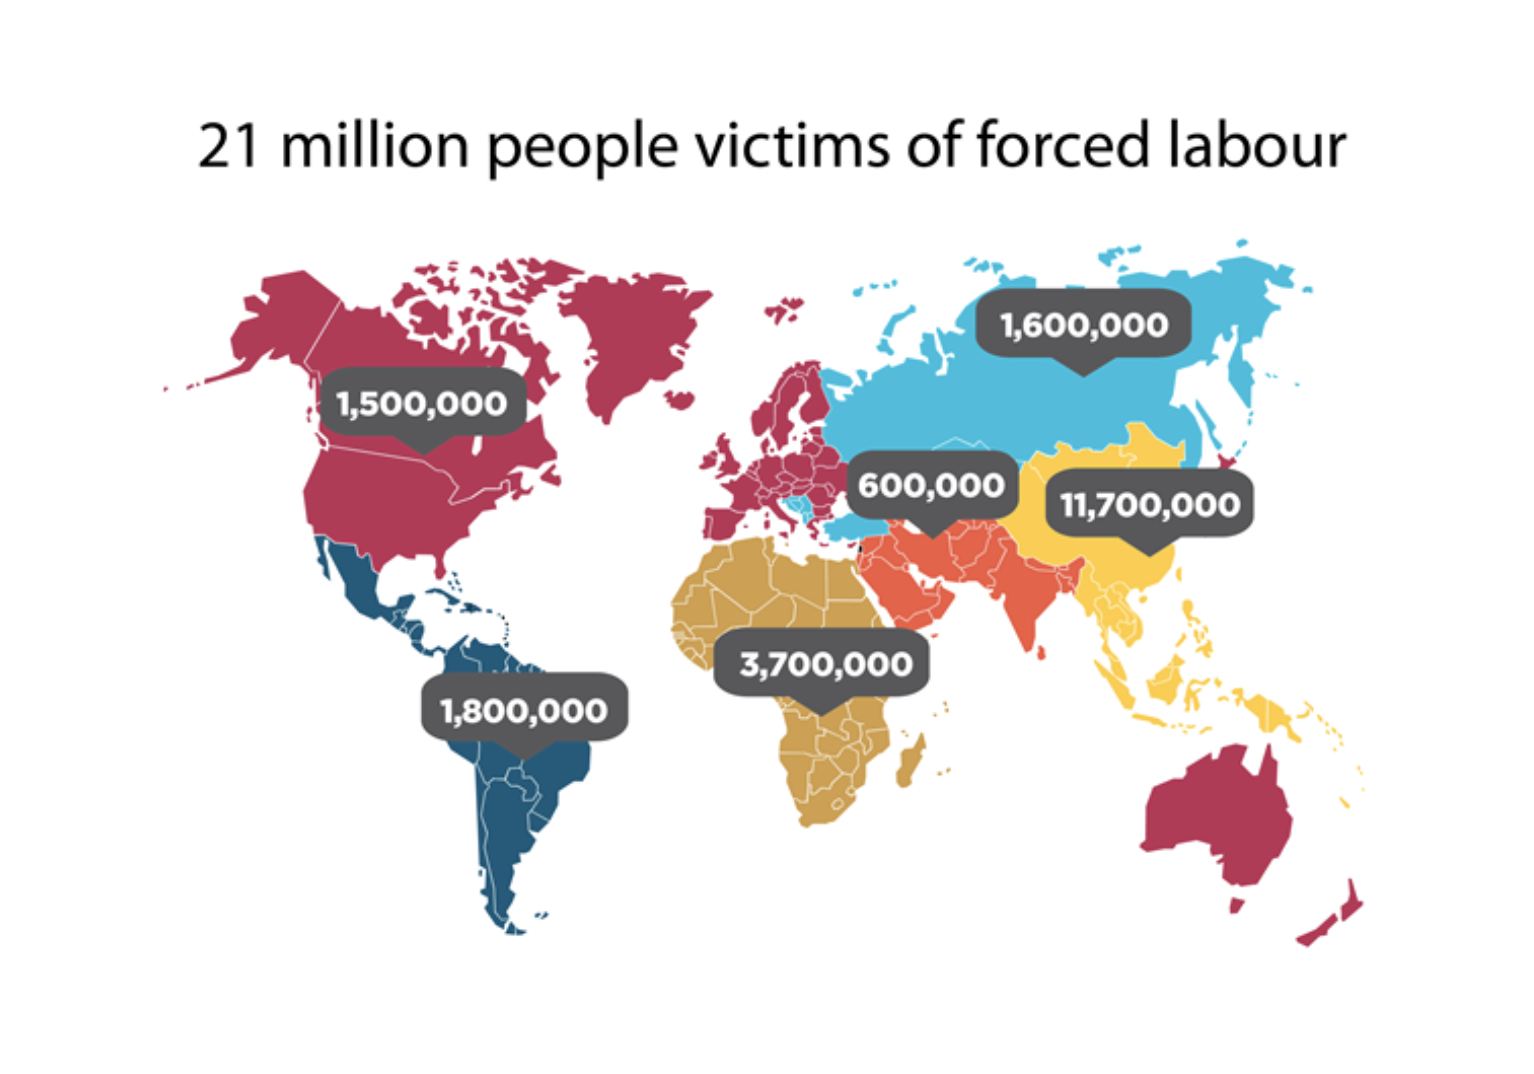
The first graphic provides a numerical overview of victims of forced labour around the world.
Nearly 21 million people – three out of every 1,000 people worldwide – are victims of forced labour across the world, trapped in jobs which they were coerced or deceived into and which they cannot leave.
The Asia-Pacific region accounts for the largest number of forced labourers in the world; 11.7 million (56%) of the global total, followed by
Africa at 3.7 million (18%) and
Latin America with 1.8 million victims (9%).
The Developed Economies and European Union have 1.5 million (7%) forced labourers.
Central and South-eastern European countries, and the Commonwealth of Independent States account for 1.6 million (7%).
There are an estimated 600,000 (3%) victims in the Middle East.
The number of victims per thousand inhabitants is highest in the Central and South-eastern Europe and Africa regions at 4.2 and 4.0 per 1,000 inhabitants respectively. It is the lowest in the Developed Economies and European Union at 1.5 per 1,000 inhabitants. The relatively high prevalence in Central and South-eastern Europe and Commonwealth of Independent States can be explained by the fact that the population is much lower than for example in Asia and at the same time reports of trafficking for labour and sexual exploitation and of state-imposed forced labour in the region are numerous.
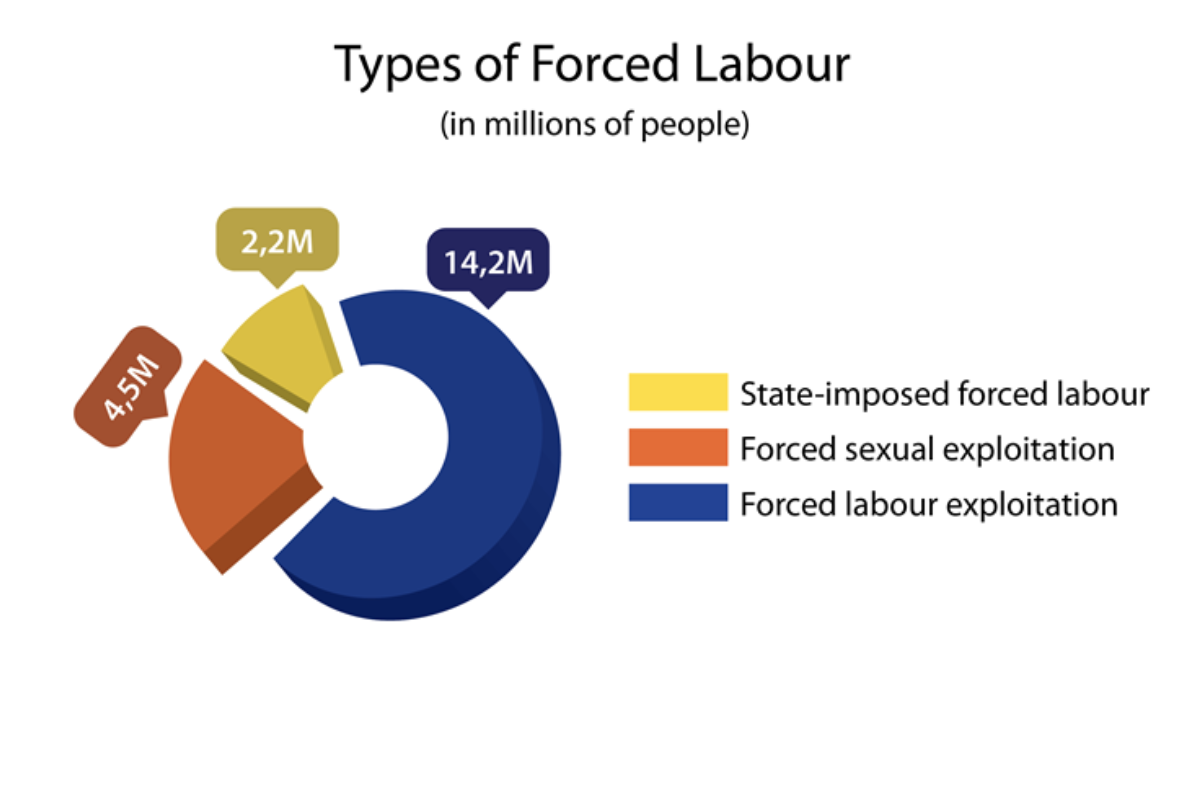
The second graphic breaks down the numbers to the different types of forced labour.
18.7 million (90%) are exploited in the private economy, by individuals or enterprises. Of these,
4.5 million (22%) are victims of forced sexual exploitation and
14.2 million (68%) are victims of forced labour exploitation in economic activities, such as agriculture, construction, domestic work or manufacturing.
2.2 million (10%) are in state-imposed forms of forced labour, for example in prisons, or in work imposed by the state military or by rebel armed forces.
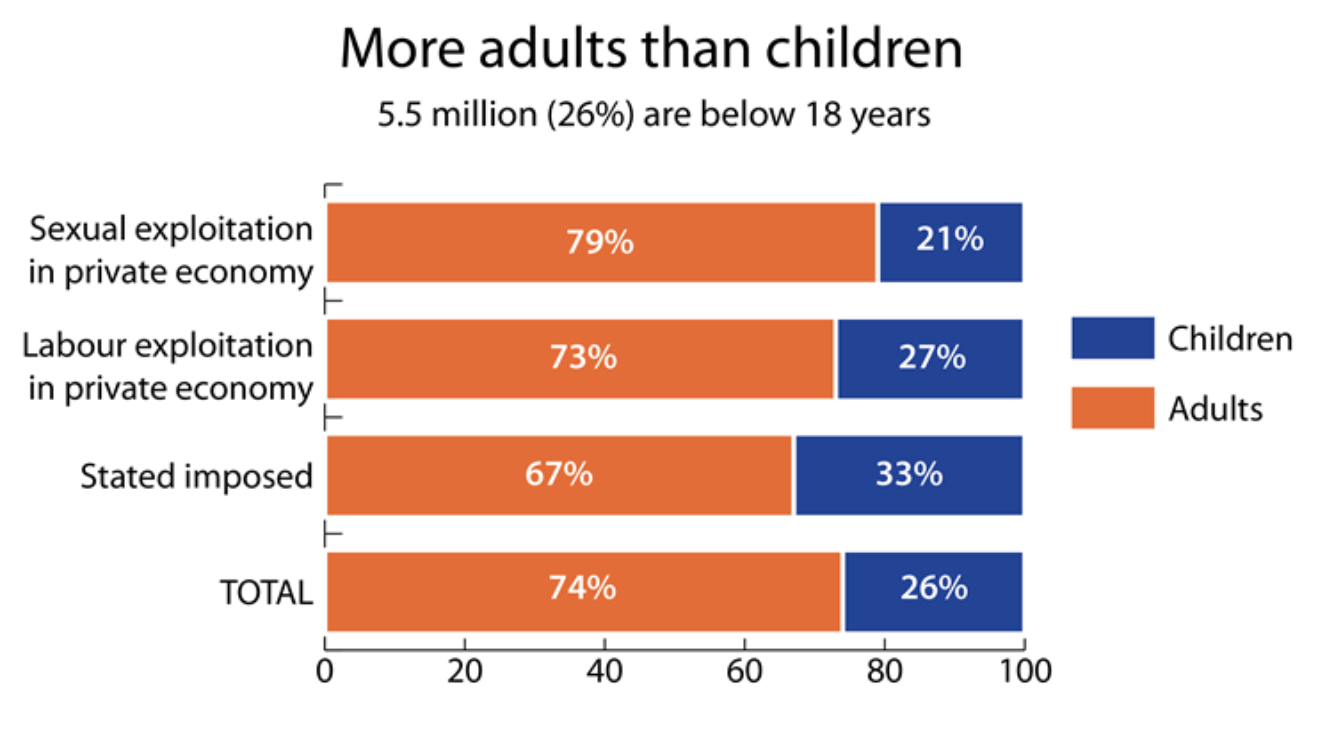
The third graphic compares the number of adult victims of forced labour to that of children.
5.5 million (26%) are below 18 years.
9.1 million victims (44%) who have moved either internally or internationally.
11.8 million (56%), the majority, are subjected to forced labour in their place of origin or residence.
Cross-border movement is heavily associated with forced sexual exploitation.
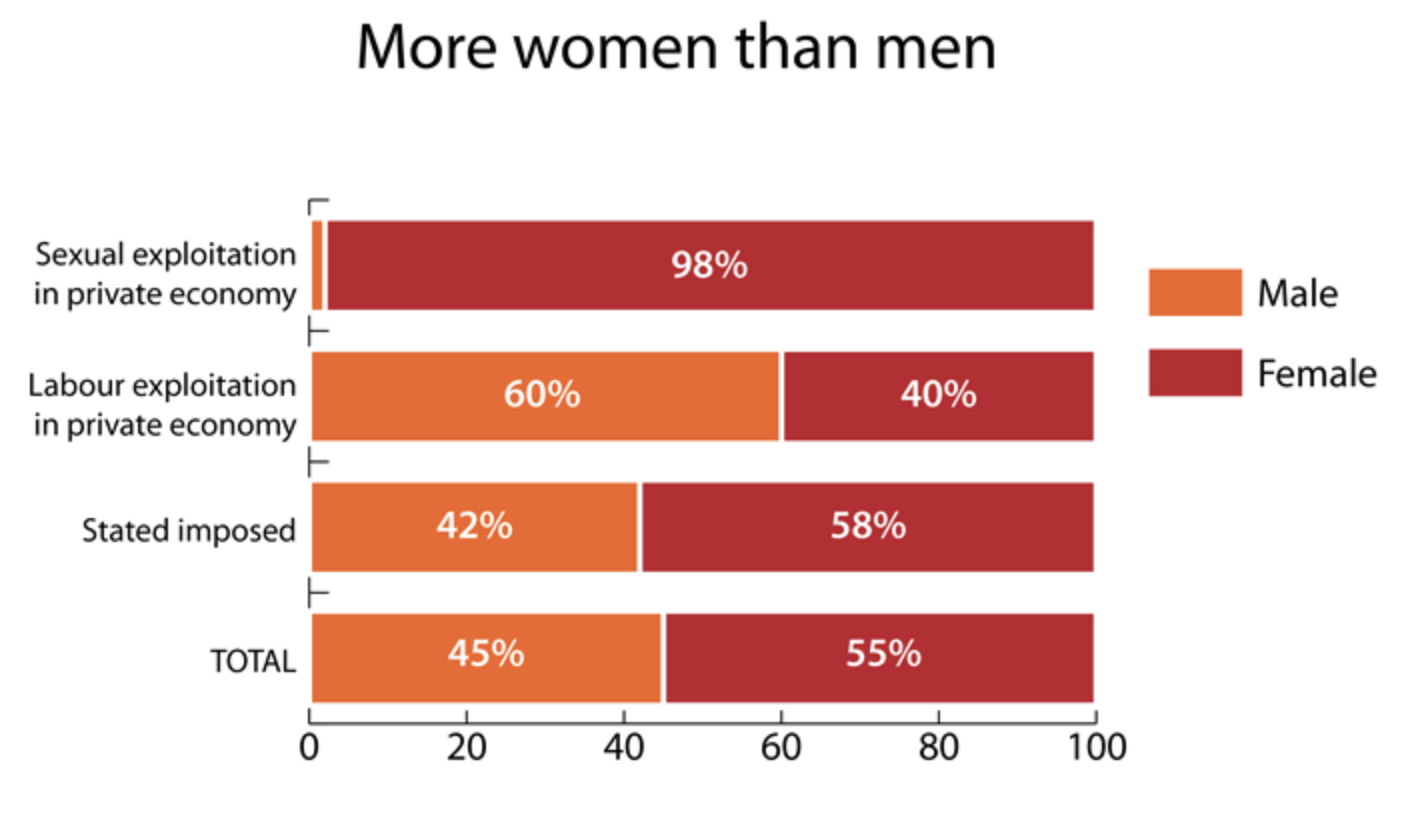
The fourth graphic compares the number of female victims of forced labour to the number of male victims.
Women and girls represent the greater share of the total– 11.4 million (55%), as compared to 9.5 million (45%) men and boys.
The graphics can be found here, by clicking on the first image. The full report and other resources can also be found via the same page.
Introduction In 2005, the International Labour Office (ILO) published its first global estimate of forced labour. The estimate (a minimum of 12.3 million persons in forced labour at any point in time in the period 1995-2004) received considerable attention by...
The data in this report represents signals and cases from January 1, 2018 through December 31, 2018 and is accurate as of July 25, 2019. Cases of trafficking may be ongoing or new information may revealed to the National Hotline over time. Consequen...Read More
The data in this report represents signals and cases from January 1, 2019 through December 31, 2019 and is accurate as of July 30, 2020. Cases of trafficking may be ongoing or new information may revealed to the National Hotline over time. Consequen...Read More
Mars Inc. has teamed up with a range of partners in Côte d’Ivoire to help farmers produce better crops and increase their incomes; to help communities improve their living standards; and to fight child labour by making sure children go to school...Read More