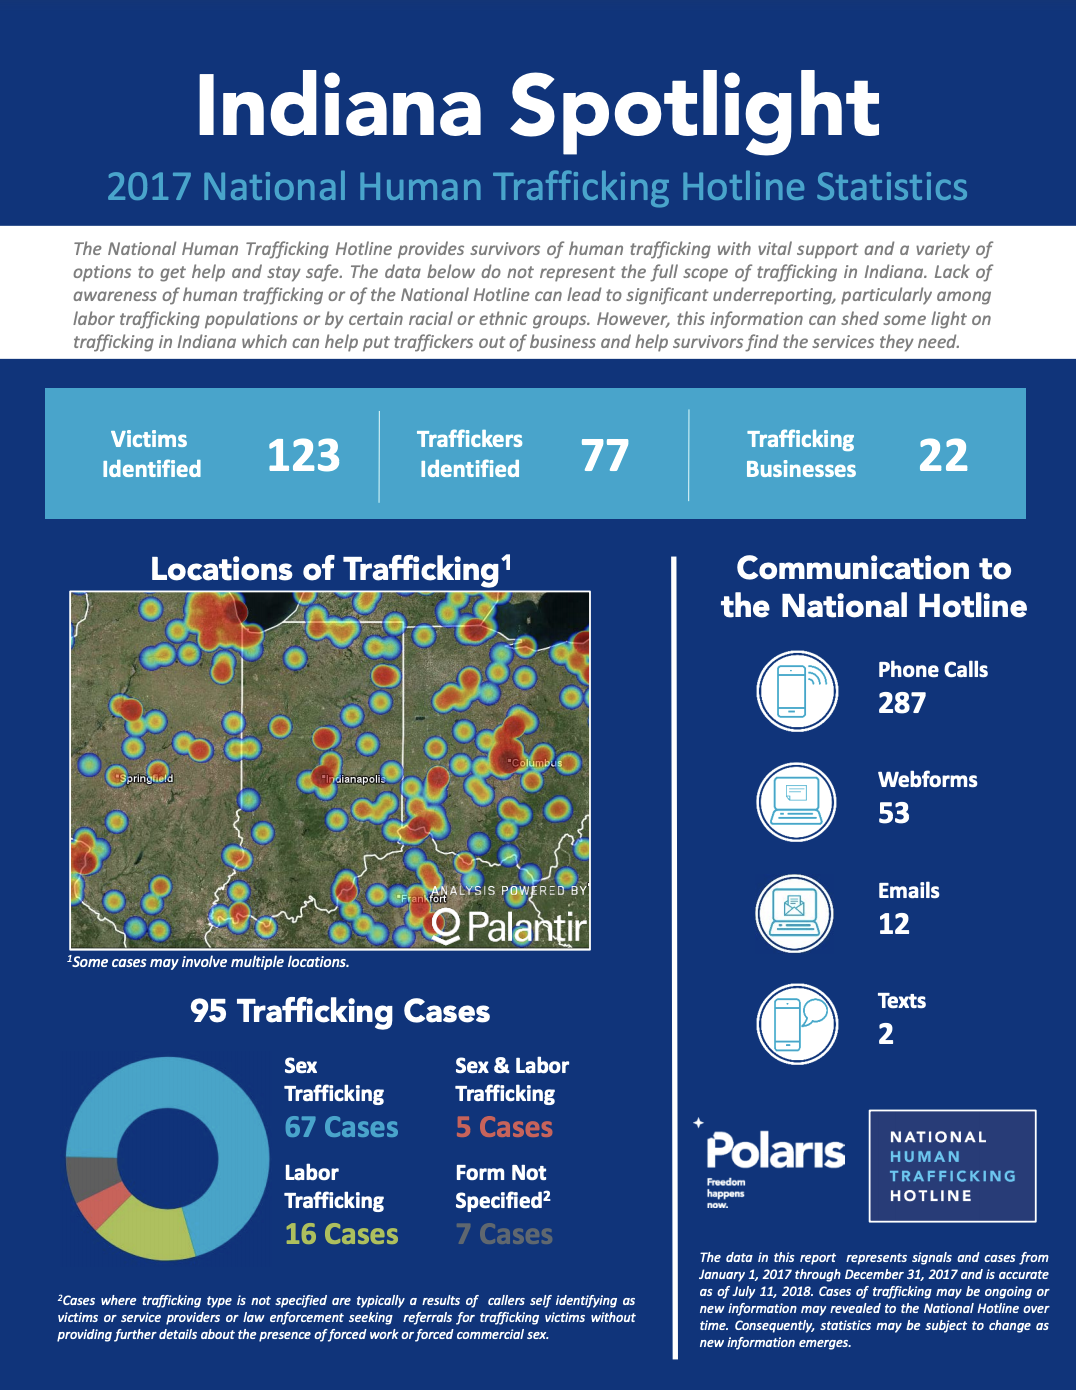
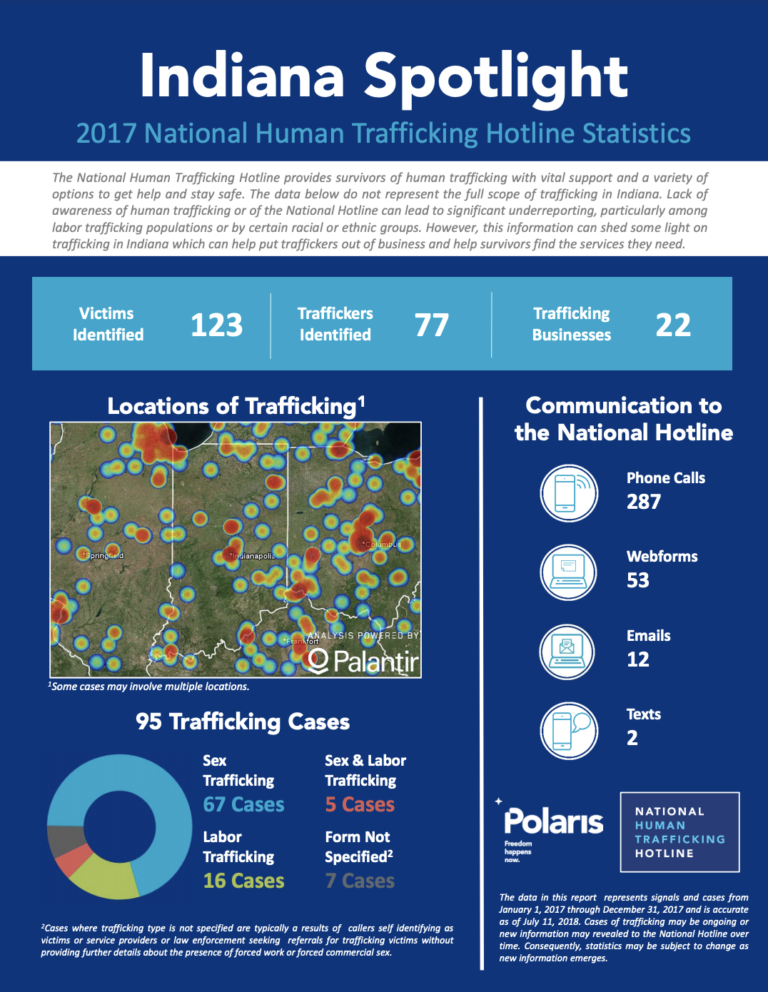
The data in this report represents signals and cases from January 1, 2017 through December 31, 2017 and is accurate as of July 11, 2018. Cases of trafficking may be ongoing or new information may be revealed to the National Hotline over time. Consequently, statistics may be subject to change as new information emerges.

You can download the report infographic below.

National Hotline 2017 Indiana State Report - National Human Trafficking Hotline, 2018 DOWNLOAD

post

page

attachment

revision

nav_menu_item

custom_css

customize_changeset

oembed_cache

user_request

wp_block

acf-field-group

acf-field

ai1ec_event

National Hotline 2019 New York State Report
Graphics & InfographicsPublications

The data in this report represents signals and cases from January 1, 2019 through December 31, 2019 and is accurate as of July 30, 2020. Cases of trafficking may be ongoing or new information may revealed to the National Hotline over time. Consequen...Read More

Investor Snapshot: Forced Labour in the Foresting Industry
Publications

It is estimated that 13 million workers are employed in the formal forestry sector while another 41 million workers are employed in the informal forestry sector. Much of this work takes place in remote areas where there is a lack of regulatory overs...Read More

Uprooted: The Growing Crisis for Refugee and Migrant Children
Publications

Around the world, nearly 50 million children have migrated across borders or been forcibly displaced. This report presents– for the first time – comprehensive, global data about these children– where they are born, where they move and some of ...Read More

TAGS: Global
National Hotline 2018 South Dakota State Report
Graphics & InfographicsPublications

The data in this report represents signals and cases from January 1, 2018 through December 31, 2018 and is accurate as of July 25, 2019. Cases of trafficking may be ongoing or new information may revealed to the National Hotline over time. Consequen...Read More