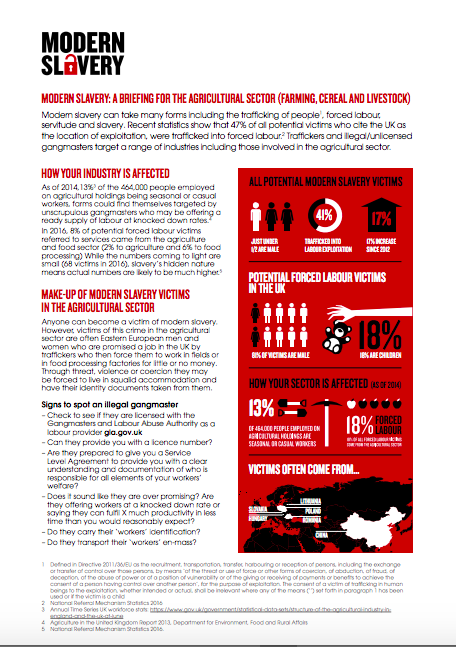
Modern slavery can take many forms including the trafficking of people, forced labour, servitude and slavery. Recent statistics show that 47% of all potential victims who cite the UK as the location of exploitation, were trafficked into forced labour. Traffickers and illegal/unlicensed gangmasters target a range of industries including those involved in the agricultural sector.

How Your Industry Is Affected
As of 2014,13% of the 464,000 people employed on agricultural holdings being seasonal or casual workers, farms could find themselves targeted by unscrupulous gangmasters who may be offering a ready supply of labour at knocked down rates. In 2016, 8% of potential forced labour victims referred to services came from the agriculture and food sector (2% to agriculture and 6% to food processing) While the numbers coming to light are small (68 victims in 2016), slavery’s hidden nature means actual numbers are likely to be much higher.

Agricultural sector factsheet Modern Slavery: A Briefing For the Agricultural Sector (Farming, Cereal and Livestock) DOWNLOAD

post

page

attachment

revision

nav_menu_item

custom_css

customize_changeset

oembed_cache

user_request

wp_block

acf-field-group

acf-field

ai1ec_event

National Hotline 2017 Virginia State Report
Graphics & InfographicsPublications

The data in this report represents signals and cases from January 1, 2017 through December 31, 2017 and is accurate as of July 11, 2018. Cases of trafficking may be ongoing or new information may be revealed to the National Hotline over time. Conseq...Read More

National Hotline 2018 Nebraska State Report
Graphics & InfographicsPublications

The data in this report represents signals and cases from January 1, 2018 through December 31, 2018 and is accurate as of July 25, 2019. Cases of trafficking may be ongoing or new information may revealed to the National Hotline over time. Consequen...Read More

National Hotline 2018 Kentucky State Report
Graphics & InfographicsPublications

The data in this report represents signals and cases from January 1, 2018 through December 31, 2018 and is accurate as of July 25, 2019. Cases of trafficking may be ongoing or new information may revealed to the National Hotline over time. Consequen...Read More

National Hotline 2018 Michigan State Report
Graphics & InfographicsPublications

The data in this report represents signals and cases from January 1, 2018 through December 31, 2018 and is accurate as of July 25, 2019. Cases of trafficking may be ongoing or new information may revealed to the National Hotline over time. Consequen...Read More