According to the International Labour Organization (ILO), an estimated 21 million people are victims of forced labor around the world. As defined by the ILO, forced labor refers to “situations in which persons are coerced to work through the use of violence or intimidation, or by more subtle means such as accumulated debt, retention of identity papers or threats of denunciation to immigration authorities.” The agricultural sector alone (including forestry and fishing) generates an estimated US$9 billion in illegal profits from forced labor each year.

The KnowTheChain benchmark evaluates corporate efforts to assess forced labor risks in their supply chains. The report found that food and beverage companies demonstrate a growing awareness and commitment to addressing forced labor, but need to particularly adapt their traceability, purchasing, and recruitment policies and practices to better understand
and address the specific risks inherent to their sector.

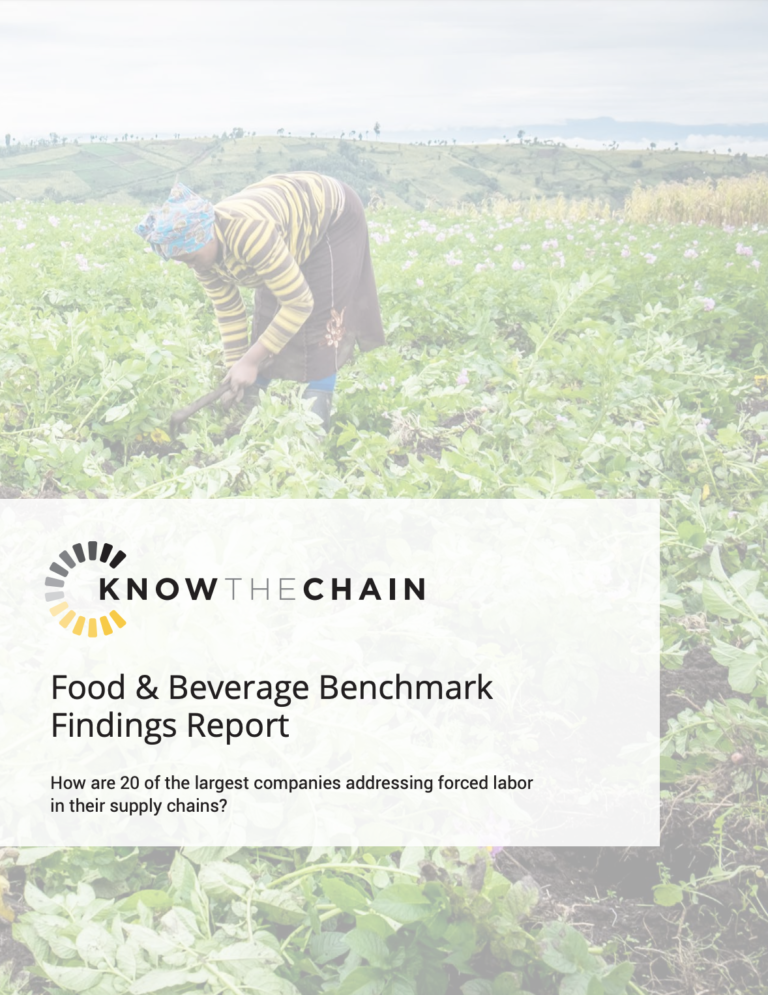
Food & Beverage Benchmark Findings Report - KnowTheChain, 2016 DOWNLOAD

post

page

attachment

revision

nav_menu_item

custom_css

customize_changeset

oembed_cache

user_request

wp_block

wp_template

wp_template_part

wp_global_styles

wp_navigation

wp_font_family

wp_font_face

acf-taxonomy

acf-post-type

acf-field-group

acf-field

ai1ec_event

exactmetrics_note

The Global Slavery Index 2023
Publications

This edition of the Index highlights how fragile hard-won human rights still are throughout the world, and how in times of crisis — be it the COVID-19 pandemic, the growing climate crisis, or ongoing armed conflict — it is the world’s most vul...Read More

TAGS:
National Hotline 2018 New York State Report
Graphics & InfographicsPublications

The data in this report represents signals and cases from January 1, 2018 through December 31, 2018 and is accurate as of July 25, 2019. Cases of trafficking may be ongoing or new information may revealed to the National Hotline over time. Consequen...Read More

National Hotline 2018 West Virginia State Report
Graphics & InfographicsPublications

The data in this report represents signals and cases from January 1, 2018 through December 31, 2018 and is accurate as of July 25, 2019. Cases of trafficking may be ongoing or new information may revealed to the National Hotline over time. Consequen...Read More

National Hotline 2017 Oregon State Report
Graphics & InfographicsPublications

The data in this report represents signals and cases from January 1, 2017 through December 31, 2017 and is accurate as of July 11, 2018. Cases of trafficking may be ongoing or new information may be revealed to the National Hotline over time. Conseq...Read More