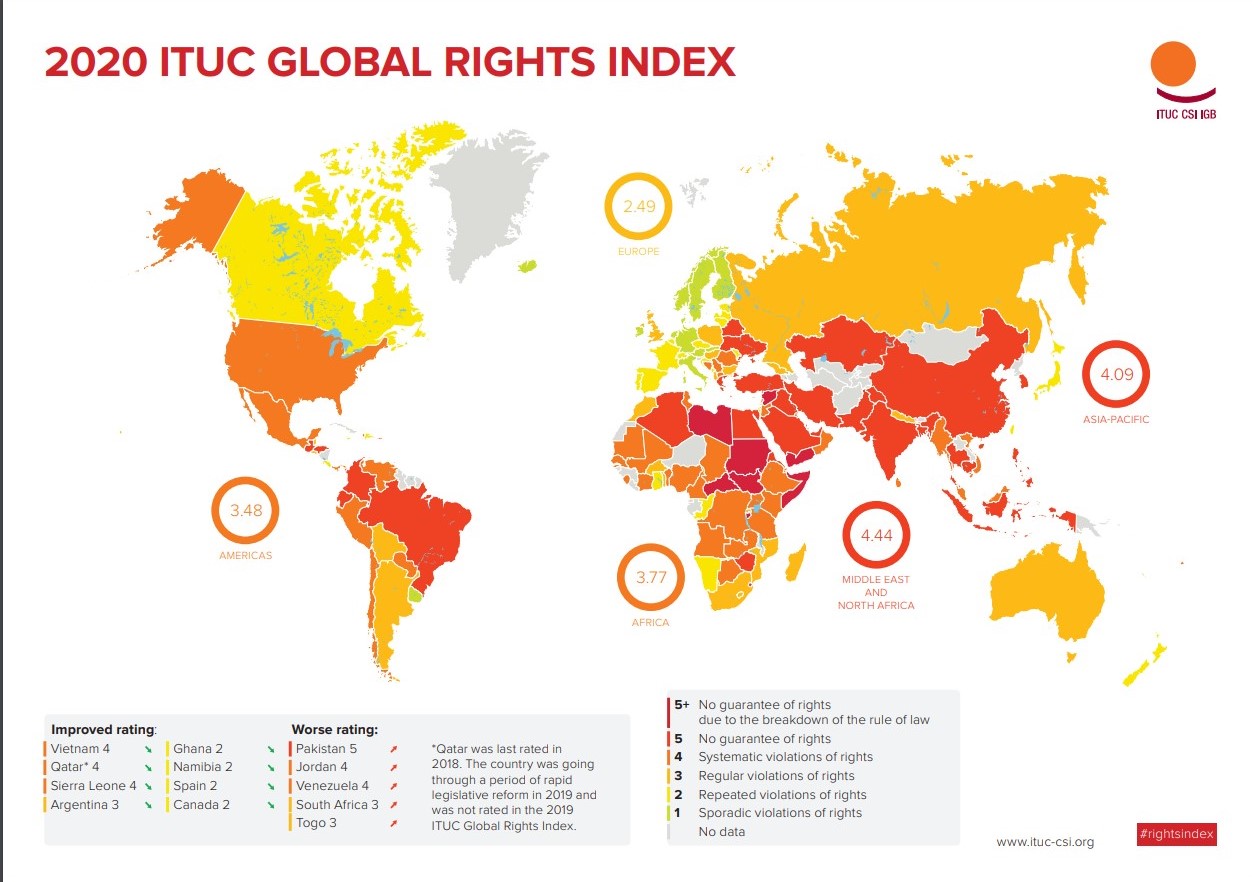
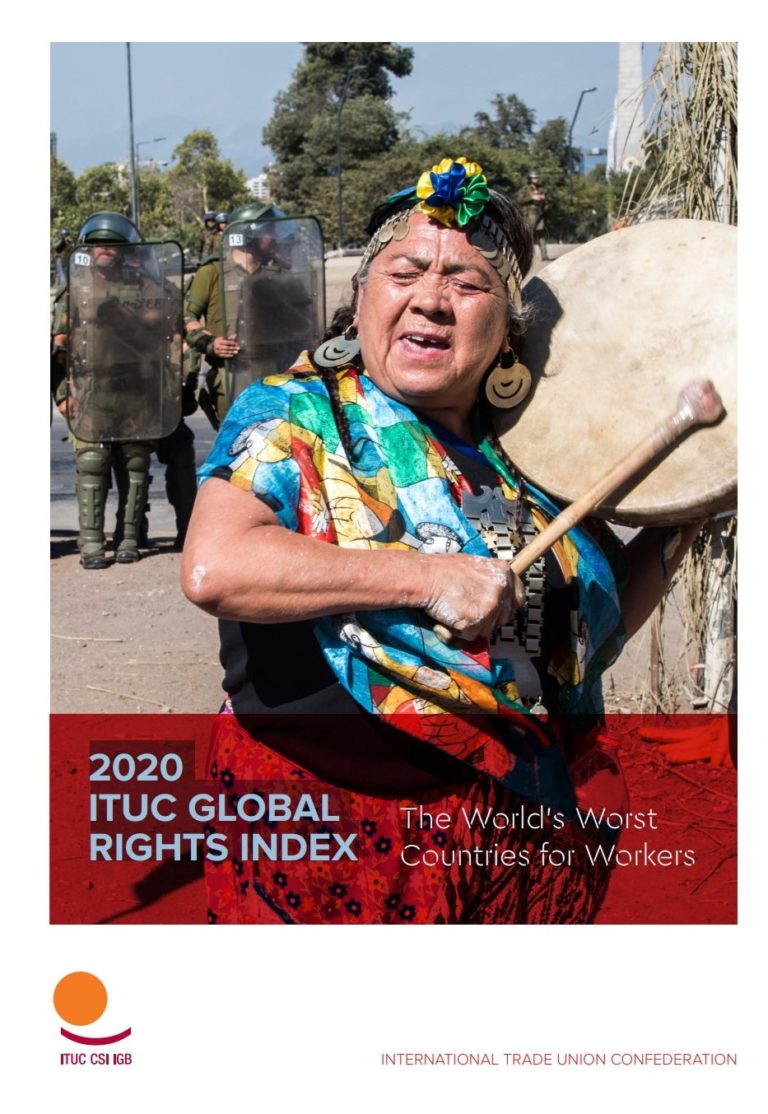
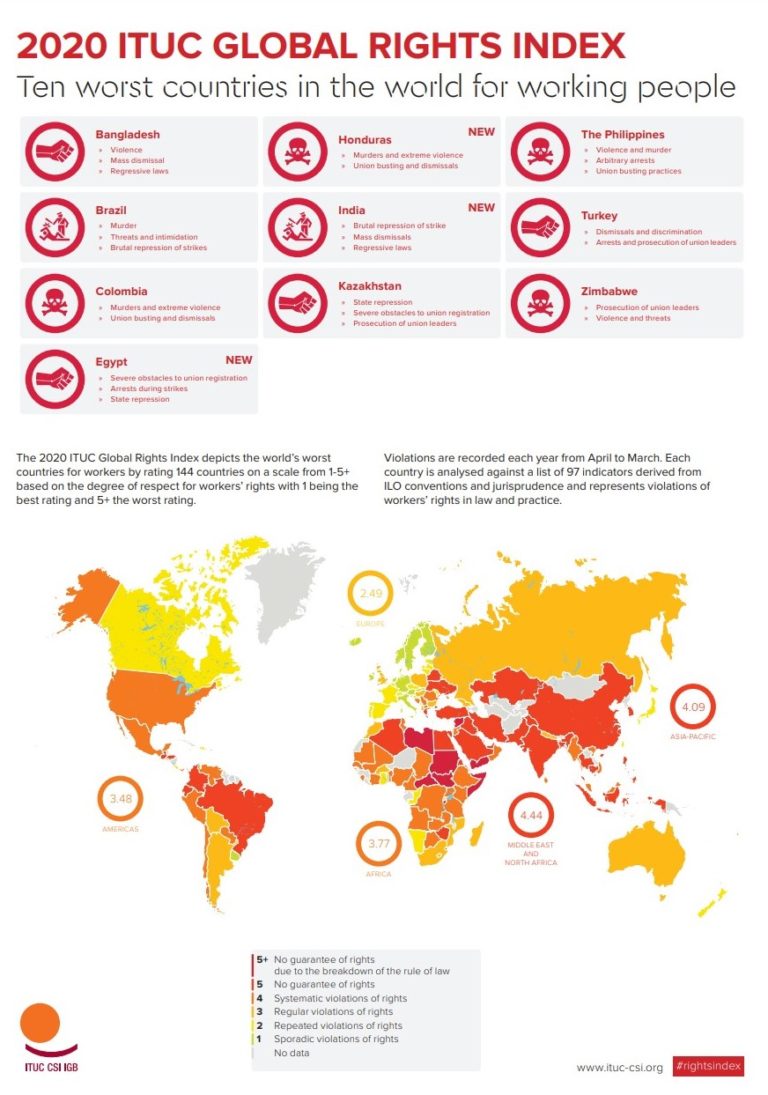
The breakdown of the social contract is exposed in the 2020 ITUC Global Rights Index with violations of workers’ rights at a seven-year high. The trends by governments and employers to restrict the rights of workers through violations of collective bargaining and the right to strike, and excluding workers from unions, have been made worse in 2020 by an increase in the number of countries which impede the registration of unions – denying workers both representation and rights

Download the full infographic and report below.

ITUC Global Rights Index- International Trade Union Confederation, 2020 DOWNLOAD
ITUC Global Rights Index infographic)- International Trade Union Confederation, 2020 DOWNLOAD

post

page

attachment

revision

nav_menu_item

custom_css

customize_changeset

oembed_cache

user_request

wp_block

wp_template

wp_template_part

wp_global_styles

wp_navigation

wp_font_family

wp_font_face

acf-taxonomy

acf-post-type

acf-field-group

acf-field

ai1ec_event

exactmetrics_note

National Hotline 2019 Louisiana State Report
Graphics & InfographicsPublications

The data in this report represents signals and cases from January 1, 2019 through December 31, 2019 and is accurate as of July 30, 2020. Cases of trafficking may be ongoing or new information may revealed to the National Hotline over time. Consequen...Read More

Pervasive, punitive, and predetermined: Understanding modern slavery in North Korea
Publications

By Remco E. Breuker & Imke van Gardingen It has long been known, though difficult to verify, that citizens of North Korea are forced to work by the State on a far greater scale than seen elsewhere in the world. Recent estimates reveal that 1 in ...Read More

TAGS: Asia
Modern Slavery PEC Impact Report for 2019-2022
News & AnalysisPublications

Slavery is a complex phenomenon and a pervasivescar on humanity. The control of another person, theexploitation of their body and labour, and the removalof their rights, is a degradation of all concerned. It isall too easy to see this as a problem o...Read More

TAGS:
National Hotline 2018 Vermont State Report
Graphics & InfographicsPublications

The data in this report represents signals and cases from January 1, 2018 through December 31, 2018 and is accurate as of July 25, 2019. Cases of trafficking may be ongoing or new information may revealed to the National Hotline over time. Consequen...Read More