Survey data suggests that a minimum, some 229,000 Nepali’s were subject to some form of modern slavery in 2014. While some of this involved victims and offenders within Nepal itself, a significant proportion is likely to have been exploited outside of Nepal itself. Given the limits of surveys in uncovering hidden populations, and that other estimates of related concepts such as forced and bonded labour place the numbers much higher, it is very likely that this survey estimate under-represents the true scale of modern slavery as it affects Nepalis.

Thsi report is based on data obtained through: reviewing published research and news reports, in-depht interviews conducted in 2014 with 55 civil society organisations and government offices in Nepal, and analysis of random sample, nationally representative survey dta from 2014 GLobal Slavery Index Nepal survey results.

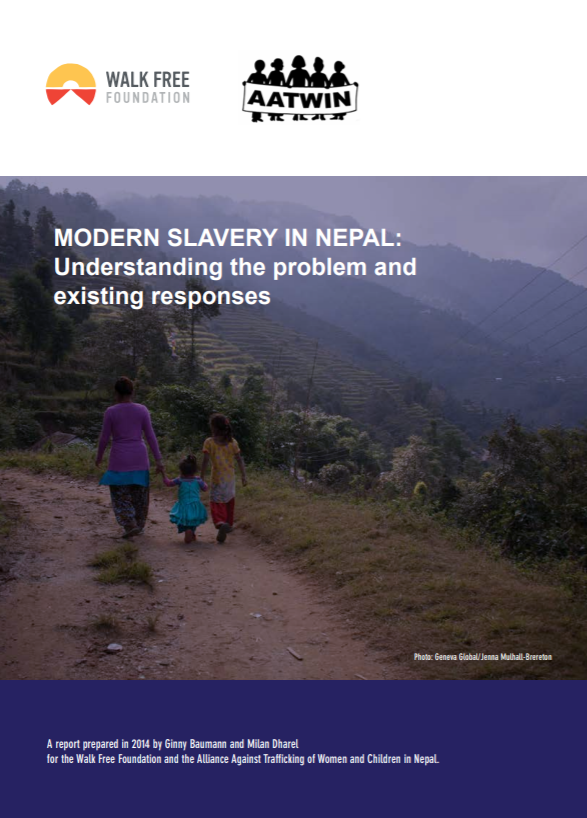
Modern Slavery in Nepal: Understanding the problem and existing responses - Minderoo Foundation - 2014 DOWNLOAD

post

page

attachment

revision

nav_menu_item

custom_css

customize_changeset

oembed_cache

user_request

wp_block

wp_template

wp_template_part

wp_global_styles

wp_navigation

wp_font_family

wp_font_face

acf-taxonomy

acf-post-type

acf-field-group

acf-field

ai1ec_event

exactmetrics_note

National Hotline 2017 Missouri State Report
Graphics & InfographicsPublications

The data in this report represents signals and cases from January 1, 2017 through December 31, 2017 and is accurate as of July 11, 2018. Cases of trafficking may be ongoing or new information may be revealed to the National Hotline over time. Conseq...Read More

It’s a Journey We Travel Together: Women Migrants Fighting for a Just Society
News & AnalysisPublications

This report describes the Feminist Participatory Action Research (FPAR) carried out by seven organisations from six countries across Asia and the Pacific region (Kyrgyzstan, Nepal, India, Malaysia, Indonesia and Hong Kong) between 2019 and 2021. The...Read More

National Hotline 2019 South Dakota State Report
Graphics & InfographicsPublications

The data in this report represents signals and cases from January 1, 2019 through December 31, 2019 and is accurate as of July 30, 2020. Cases of trafficking may be ongoing or new information may revealed to the National Hotline over time. Consequen...Read More

National Hotline 2018 Indiana State Report
Graphics & InfographicsPublications

The data in this report represents signals and cases from January 1, 2018 through December 31, 2018 and is accurate as of July 25, 2019. Cases of trafficking may be ongoing or new information may revealed to the National Hotline over time. Consequen...Read More