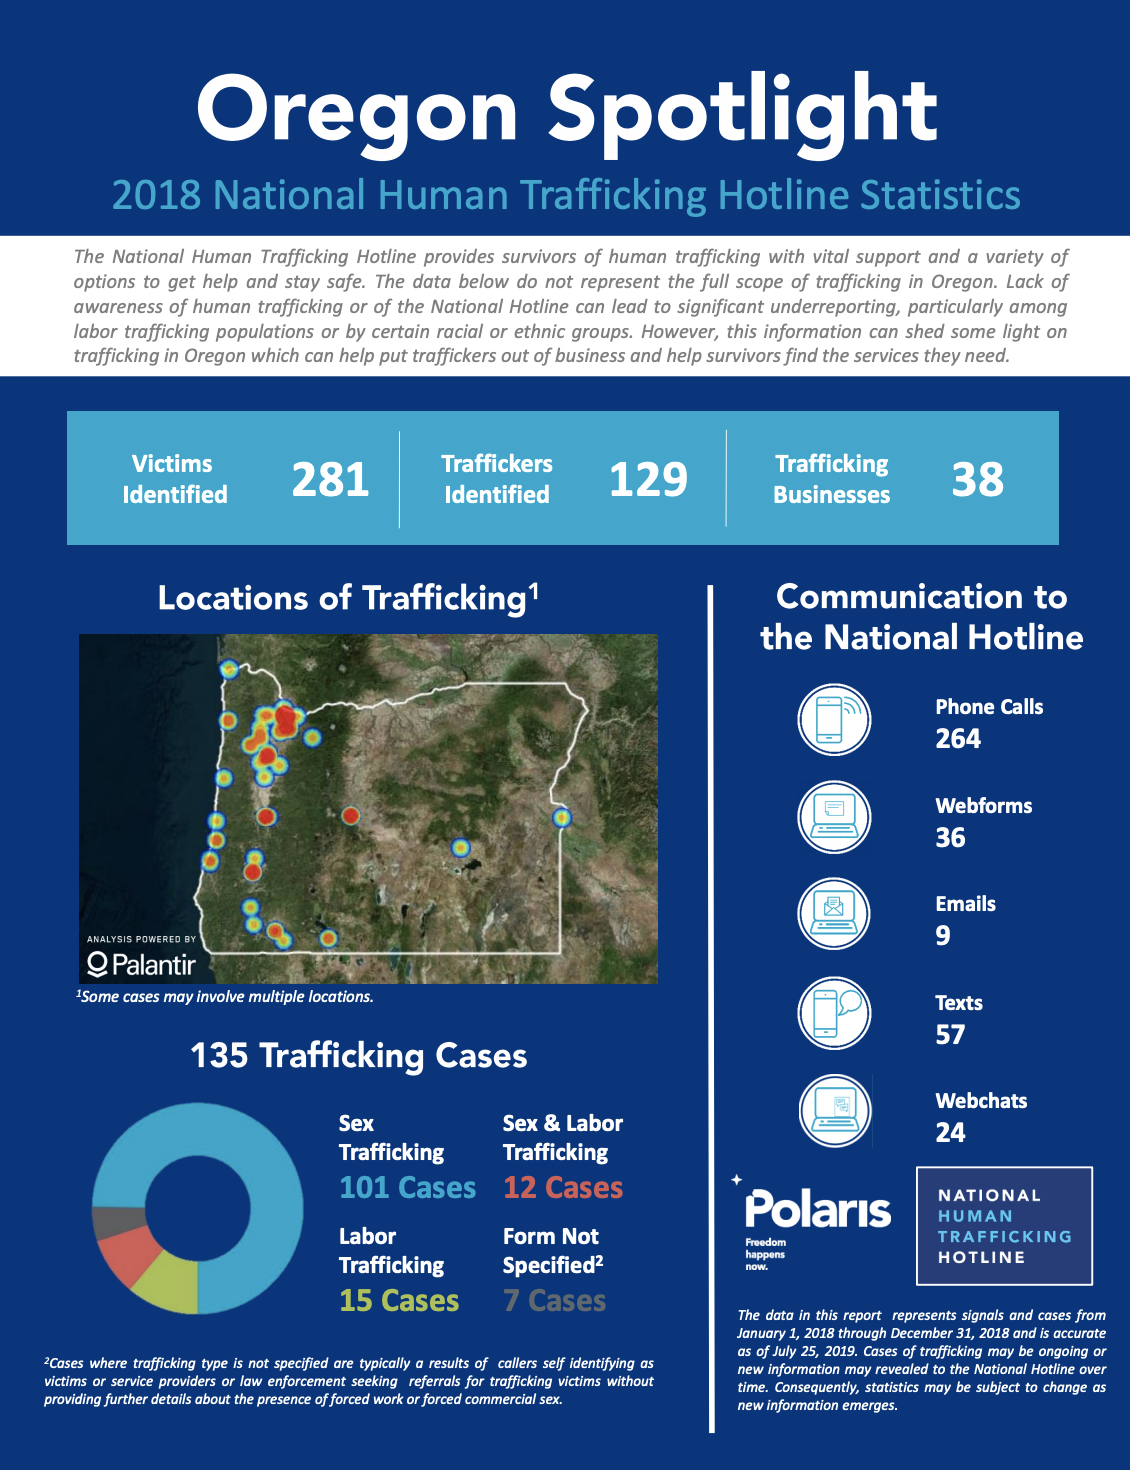
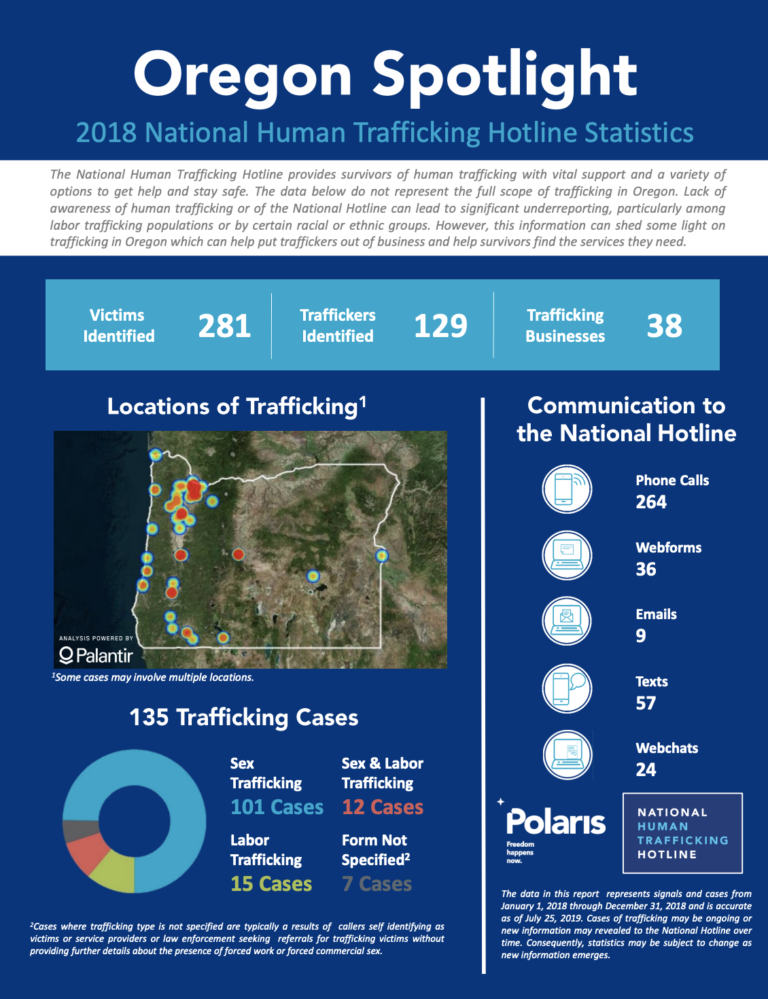
The data in this report represents signals and cases from January 1, 2018 through December 31, 2018 and is accurate as of July 25, 2019. Cases of trafficking may be ongoing or new information may revealed to the National Hotline over time. Consequently, statistics may be subject to change as new information emerges.

You can download the report infographic below.

National Hotline 2018 Oregon State Report - National Human Trafficking Hotline, 2019 DOWNLOAD

post

page

attachment

revision

nav_menu_item

custom_css

customize_changeset

oembed_cache

user_request

wp_block

acf-field-group

acf-field

ai1ec_event

ITUC Global Rights Index
Graphics & InfographicsPublications

The breakdown of the social contract is exposed in the 2020 ITUC Global Rights Index with violations of workers’ rights at a seven-year high. The trends by governments and employers to restrict the rights of workers through violations of collecti...Read More

National Hotline 2019 Minnesota State Report
Graphics & InfographicsPublications

The data in this report represents signals and cases from January 1, 2019 through December 31, 2019 and is accurate as of July 30, 2020. Cases of trafficking may be ongoing or new information may revealed to the National Hotline over time. Consequen...Read More

A practical guide for SMEs on how to mitigate the risk of modern slavery in their operations.
GuidancePublications

This toolkit, jointly developed by STOP THE TRAFFIK and Shiva Foundation, seeks to provide practical guidance for small and medium-sized enterprises (SMEs) on how they can prevent modern slavery in their business operations. We recognise that many u...Read More

TAGS: Europe
National Hotline 2019 Hawaii State Report
Graphics & InfographicsPublications

The data in this report represents signals and cases from January 1, 2019 through December 31, 2019 and is accurate as of July 30, 2020. Cases of trafficking may be ongoing or new information may revealed to the National Hotline over time. Consequen...Read More