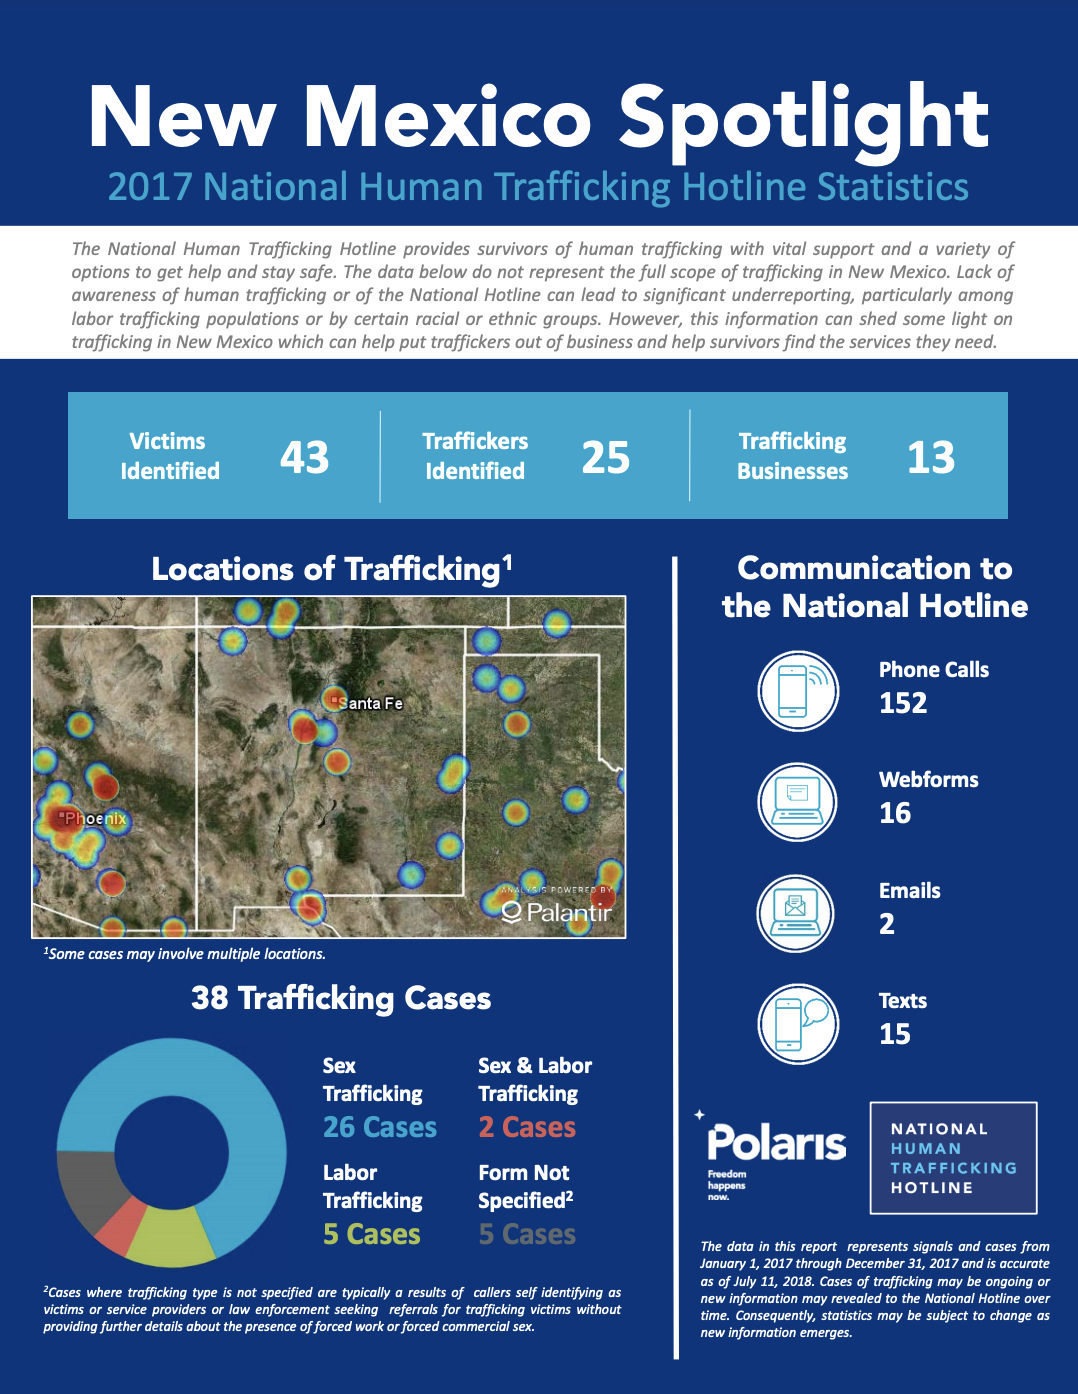
The data in this report represents signals and cases from January 1, 2017 through December 31, 2017 and is accurate as of July 11, 2018. Cases of trafficking may be ongoing or new information may be revealed to the National Hotline over time. Consequently, statistics may be subject to change as new information emerges.

You can download the report infographic below.

National Hotline 2017 New Mexico State Report - National Human Trafficking Hotline, 2018 DOWNLOAD

post

page

attachment

revision

nav_menu_item

custom_css

customize_changeset

oembed_cache

user_request

wp_block

wp_template

wp_template_part

wp_global_styles

wp_navigation

wp_font_family

wp_font_face

acf-taxonomy

acf-post-type

acf-field-group

acf-field

ai1ec_event

exactmetrics_note

National Hotline 2017 Vermont State Report
Graphics & InfographicsPublications

The data in this report represents signals and cases from January 1, 2017 through December 31, 2017 and is accurate as of July 11, 2018. Cases of trafficking may be ongoing or new information may be revealed to the National Hotline over time. Conseq...Read More

Products of Slavery (Map)
Graphics & Infographics

Products of Slavery is a data visualisation website about forced labour and child labour, also known as modern slavery, in the supply chain of many consumer goods. The site was launched by Anti-Slavery International to mark the UK’s first Anti-Slav...Read More

On History
Publications

Edited by Joel Quirk and Genevieve LeBaron. This is the fourth volume of the series Beyond Trafficking and Slavery Short Course. Campaigners and governments leading the fight to end ‘modern-day slavery’ selectively appeal to history to h...Read More

TAGS: Global
Modern slavery reporting: Is there evidence of progress?
Publications

This analysis of modern slavery statements focuses on changes in reporting and practice in addressing forced labour and human trafficking. Some key findings Under the UK Modern Slavery Act 2015, companies with a financial turnover of over £3...Read More