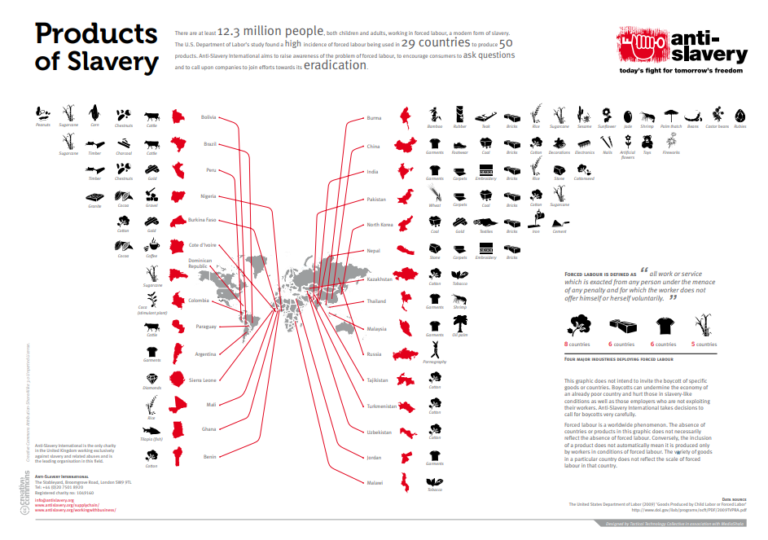
Products of Slavery is a data visualisation website about forced labour and child labour, also known as modern slavery, in the supply chain of many consumer goods. The site was launched by Anti-Slavery International to mark the UK’s first Anti-Slavery Day on Monday 18 October 2010.

Companies have a unique ability to address forced and child labour within their supply chains. Consumers also have a vital role to play in calling for companies’ action to end forced labour. The data visualisation reveals vital information about the origins of these products, whose journey to the supermarket shelves is usually so well concealed in today’s globalised economy.

The infographic/ poster below represents an overview of the data used in the project.

Download the full infographic in pdf below.

Products of Slavery (Map) - Anti-Slavery International, 2010 DOWNLOAD

post

page

attachment

revision

nav_menu_item

custom_css

customize_changeset

oembed_cache

user_request

wp_block

acf-field-group

acf-field

ai1ec_event

National Hotline 2018 Ohio State Report
Graphics & InfographicsPublications

The data in this report represents signals and cases from January 1, 2018 through December 31, 2018 and is accurate as of July 25, 2019. Cases of trafficking may be ongoing or new information may revealed to the National Hotline over time. Consequen...Read More

Factsheet, Modern Slavery: A Briefing for the Food Industry (Manufacturing, Processing)
Graphics & Infographics

Modern slavery can take many forms including the trafficking of people, forced labour, servitude and slavery. Recent statistics show that 47% of all potential victims who cite the UK as the location of exploitation, were trafficked into forced labou...Read More

Ending child labour will be decided in agriculture
Graphics & Infographics

The necessary steps towards eliminating child labour and accelerating towards achieving SDG 8.7 Infographic accessible here. ...Read More

National Hotline 2019 New Mexico State Report
Graphics & InfographicsPublications

The data in this report represents signals and cases from January 1, 2019 through December 31, 2019 and is accurate as of July 30, 2020. Cases of trafficking may be ongoing or new information may revealed to the National Hotline over time. Consequen...Read More